
 Yahoo Finance
 Is Melco International Development Limited's (HKG:200) Balance Sheet A Threat To Its Future?

Want to participate in a short research study? Help shape the future of investing tools and you could win a $250 gift card!
Investors are always looking for growth in small-cap stocks like Melco International Development Limited (HKG:200), with a market cap of HK$28b. However, an important fact which most ignore is: how financially healthy is the business? Evaluating financial health as part of your investment thesis is essential, since poor capital management may bring about bankruptcies, which occur at a higher rate for small-caps. We'll look at some basic checks that can form a snapshot the company’s financial strength. Nevertheless, potential investors would need to take a closer look, and I’d encourage you to dig deeper yourself into 200 here.
Does 200 Produce Much Cash Relative To Its Debt?
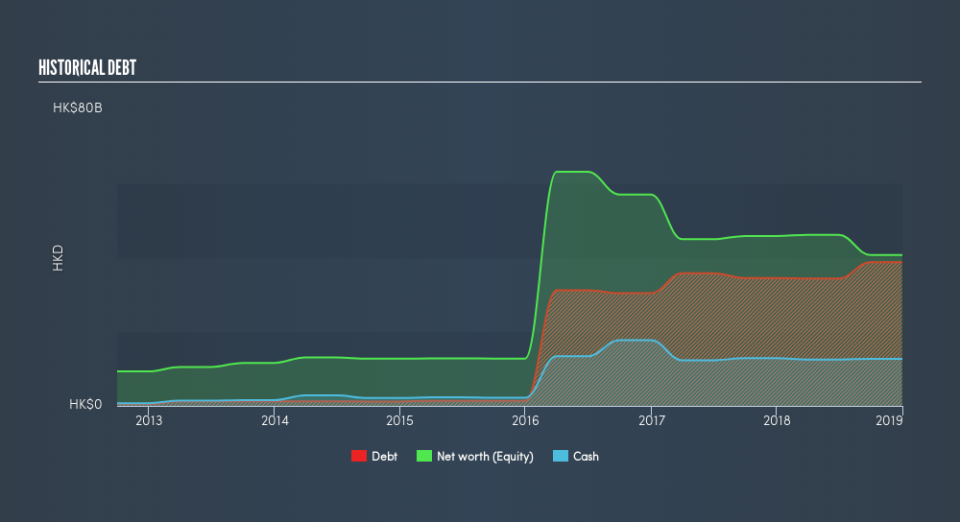
200 has built up its total debt levels in the last twelve months, from HK$37b to HK$41b – this includes long-term debt. With this increase in debt, the current cash and short-term investment levels stands at HK$13b to keep the business going. On top of this, 200 has generated cash from operations of HK$10b during the same period of time, leading to an operating cash to total debt ratio of 25%, meaning that 200’s current level of operating cash is high enough to cover debt.
Can 200 pay its short-term liabilities?
With current liabilities at HK$17b, it seems that the business may not be able to easily meet these obligations given the level of current assets of HK$16b, with a current ratio of 0.93x. The current ratio is calculated by dividing current assets by current liabilities.
Is 200’s debt level acceptable?
With total debt exceeding equity, 200 is considered a highly levered company. This is a bit unusual for a small-cap stock, since they generally have a harder time borrowing than large more established companies. We can test if 200’s debt levels are sustainable by measuring interest payments against earnings of a company. Ideally, earnings before interest and tax (EBIT) should cover net interest by at least three times. For 200, the ratio of 1.72x suggests that interest is not strongly covered, which means that debtors may be less inclined to loan the company more money, reducing its headroom for growth through debt.
Next Steps:
200’s high cash coverage means that, although its debt levels are high, the company is able to utilise its borrowings efficiently in order to generate cash flow. Though its lack of liquidity raises questions over current asset management practices for the small-cap. I admit this is a fairly basic analysis for 200's financial health. Other important fundamentals need to be considered alongside. I suggest you continue to research Melco International Development to get a better picture of the stock by looking at:
Future Outlook: What are well-informed industry analysts predicting for 200’s future growth? Take a look at our free research report of analyst consensus for 200’s outlook.
Valuation: What is 200 worth today? Is the stock undervalued, even when its growth outlook is factored into its intrinsic value? The intrinsic value infographic in our free research report helps visualize whether 200 is currently mispriced by the market.
Other High-Performing Stocks: Are there other stocks that provide better prospects with proven track records? Explore our free list of these great stocks here.
We aim to bring you long-term focused research analysis driven by fundamental data. Note that our analysis may not factor in the latest price-sensitive company announcements or qualitative material.
If you spot an error that warrants correction, please contact the editor at editorial-team@simplywallst.com. This article by Simply Wall St is general in nature. It does not constitute a recommendation to buy or sell any stock, and does not take account of your objectives, or your financial situation. Simply Wall St has no position in the stocks mentioned. Thank you for reading.
