
 Yahoo Finance
 Medtronic plc (NYSE:MDT): Time For A Financial Health Check

Want to participate in a short research study? Help shape the future of investing tools and receive a $20 prize!
There are a number of reasons that attract investors towards large-cap companies such as Medtronic plc (NYSE:MDT), with a market cap of US$124b. One reason being its ‘too big to fail’ aura which gives it the appearance of a strong and stable investment. But, the health of the financials determines whether the company continues to succeed. This article will examine Medtronic’s financial liquidity and debt levels to get an idea of whether the company can deal with cyclical downturns and maintain funds to accommodate strategic spending for future growth. Note that this information is centred entirely on financial health and is a high-level overview, so I encourage you to look further into MDT here.
View our latest analysis for Medtronic
How does MDT’s operating cash flow stack up against its debt?
Over the past year, MDT has reduced its debt from US$29b to US$25b – this includes long-term debt. With this reduction in debt, MDT’s cash and short-term investments stands at US$9.1b for investing into the business. On top of this, MDT has generated US$6.0b in operating cash flow over the same time period, leading to an operating cash to total debt ratio of 24%, indicating that MDT’s debt is appropriately covered by operating cash. This ratio can also be a sign of operational efficiency as an alternative to return on assets. In MDT’s case, it is able to generate 0.24x cash from its debt capital.
Can MDT meet its short-term obligations with the cash in hand?
With current liabilities at US$8.9b, it seems that the business has been able to meet these obligations given the level of current assets of US$21b, with a current ratio of 2.36x. Generally, for Medical Equipment companies, this is a reasonable ratio since there is a bit of a cash buffer without leaving too much capital in a low-return environment.
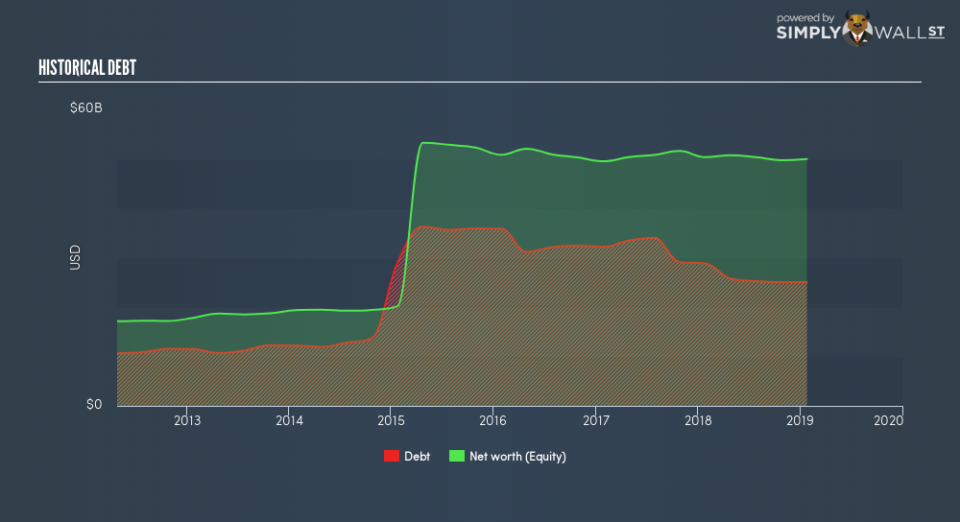
Does MDT face the risk of succumbing to its debt-load?
With debt reaching 50% of equity, MDT may be thought of as relatively highly levered. This is common amongst large-cap companies because debt can often be a less expensive alternative to equity due to tax deductibility of interest payments. Since large-caps are seen as safer than their smaller constituents, they tend to enjoy lower cost of capital. We can test if MDT’s debt levels are sustainable by measuring interest payments against earnings of a company. A company generating earnings before interest and tax (EBIT) at least three times its net interest payments is considered financially sound. For MDT, the ratio of 11.73x suggests that interest is comfortably covered. High interest coverage serves as an indication of the safety of a company, which highlights why many large organisations like MDT are considered a risk-averse investment.
Next Steps:
MDT’s debt and cash flow levels indicate room for improvement. Its cash flow coverage of less than a quarter of debt means that operating efficiency could be an issue. However, the company exhibits proper management of current assets and upcoming liabilities. This is only a rough assessment of financial health, and I’m sure MDT has company-specific issues impacting its capital structure decisions. I recommend you continue to research Medtronic to get a better picture of the stock by looking at:
Future Outlook: What are well-informed industry analysts predicting for MDT’s future growth? Take a look at our free research report of analyst consensus for MDT’s outlook.
Valuation: What is MDT worth today? Is the stock undervalued, even when its growth outlook is factored into its intrinsic value? The intrinsic value infographic in our free research report helps visualize whether MDT is currently mispriced by the market.
Other High-Performing Stocks: Are there other stocks that provide better prospects with proven track records? Explore our free list of these great stocks here.
We aim to bring you long-term focused research analysis driven by fundamental data. Note that our analysis may not factor in the latest price-sensitive company announcements or qualitative material.
If you spot an error that warrants correction, please contact the editor at editorial-team@simplywallst.com. This article by Simply Wall St is general in nature. It does not constitute a recommendation to buy or sell any stock, and does not take account of your objectives, or your financial situation. Simply Wall St has no position in the stocks mentioned. Thank you for reading.
