
 Yahoo Finance
 Mayfield Group Holdings Limited's (ASX:MYG) Stock Has Shown Weakness Lately But Financial Prospects Look Decent: Is The Market Wrong?
It is hard to get excited after looking at Mayfield Group Holdings' (ASX:MYG) recent performance, when its stock has declined 14% over the past three months. However, the company's fundamentals look pretty decent, and long-term financials are usually aligned with future market price movements. Particularly, we will be paying attention to Mayfield Group Holdings' ROE today.
Return on Equity or ROE is a test of how effectively a company is growing its value and managing investors’ money. In simpler terms, it measures the profitability of a company in relation to shareholder's equity.
See our latest analysis for Mayfield Group Holdings
How Do You Calculate Return On Equity?
The formula for ROE is:
Return on Equity = Net Profit (from continuing operations) ÷ Shareholders' Equity
So, based on the above formula, the ROE for Mayfield Group Holdings is:
6.9% = AU$1.2m ÷ AU$18m (Based on the trailing twelve months to December 2020).
The 'return' is the amount earned after tax over the last twelve months. One way to conceptualize this is that for each A$1 of shareholders' capital it has, the company made A$0.07 in profit.
What Is The Relationship Between ROE And Earnings Growth?
So far, we've learned that ROE is a measure of a company's profitability. Depending on how much of these profits the company reinvests or "retains", and how effectively it does so, we are then able to assess a company’s earnings growth potential. Generally speaking, other things being equal, firms with a high return on equity and profit retention, have a higher growth rate than firms that don’t share these attributes.
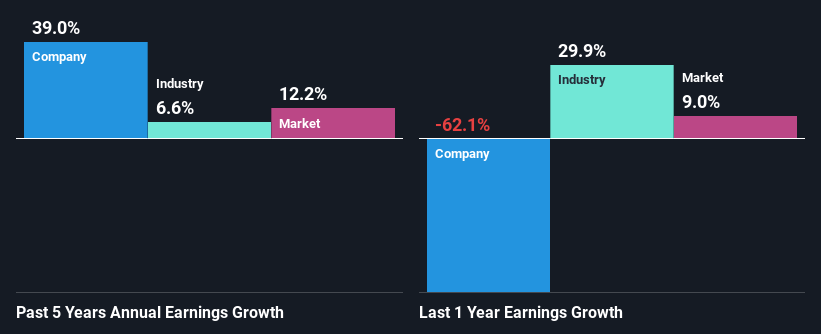
A Side By Side comparison of Mayfield Group Holdings' Earnings Growth And 6.9% ROE
On the face of it, Mayfield Group Holdings' ROE is not much to talk about. A quick further study shows that the company's ROE doesn't compare favorably to the industry average of 9.2% either. In spite of this, Mayfield Group Holdings was able to grow its net income considerably, at a rate of 39% in the last five years. So, there might be other aspects that are positively influencing the company's earnings growth. Such as - high earnings retention or an efficient management in place.
As a next step, we compared Mayfield Group Holdings' net income growth with the industry, and pleasingly, we found that the growth seen by the company is higher than the average industry growth of 17%.
The basis for attaching value to a company is, to a great extent, tied to its earnings growth. It’s important for an investor to know whether the market has priced in the company's expected earnings growth (or decline). This then helps them determine if the stock is placed for a bright or bleak future. Is Mayfield Group Holdings fairly valued compared to other companies? These 3 valuation measures might help you decide.
Is Mayfield Group Holdings Efficiently Re-investing Its Profits?
Summary
Overall, we feel that Mayfield Group Holdings certainly does have some positive factors to consider. Even in spite of the low rate of return, the company has posted impressive earnings growth as a result of reinvesting heavily into its business. While we won't completely dismiss the company, what we would do, is try to ascertain how risky the business is to make a more informed decision around the company. To know the 3 risks we have identified for Mayfield Group Holdings visit our risks dashboard for free.
This article by Simply Wall St is general in nature. We provide commentary based on historical data and analyst forecasts only using an unbiased methodology and our articles are not intended to be financial advice. It does not constitute a recommendation to buy or sell any stock, and does not take account of your objectives, or your financial situation. We aim to bring you long-term focused analysis driven by fundamental data. Note that our analysis may not factor in the latest price-sensitive company announcements or qualitative material. Simply Wall St has no position in any stocks mentioned.
Have feedback on this article? Concerned about the content? Get in touch with us directly. Alternatively, email editorial-team (at) simplywallst.com.
