
 Yahoo Finance
 Is The Market Rewarding Kronos Worldwide, Inc. (NYSE:KRO) With A Negative Sentiment As A Result Of Its Mixed Fundamentals?
With its stock down 30% over the past three months, it is easy to disregard Kronos Worldwide (NYSE:KRO). It seems that the market might have completely ignored the positive aspects of the company's fundamentals and decided to weigh-in more on the negative aspects. Fundamentals usually dictate market outcomes so it makes sense to study the company's financials. Specifically, we decided to study Kronos Worldwide's ROE in this article.
ROE or return on equity is a useful tool to assess how effectively a company can generate returns on the investment it received from its shareholders. In simpler terms, it measures the profitability of a company in relation to shareholder's equity.
View our latest analysis for Kronos Worldwide
How Do You Calculate Return On Equity?
The formula for ROE is:
Return on Equity = Net Profit (from continuing operations) ÷ Shareholders' Equity
So, based on the above formula, the ROE for Kronos Worldwide is:
18% = US$156m ÷ US$879m (Based on the trailing twelve months to September 2022).
The 'return' refers to a company's earnings over the last year. So, this means that for every $1 of its shareholder's investments, the company generates a profit of $0.18.
What Has ROE Got To Do With Earnings Growth?
So far, we've learned that ROE is a measure of a company's profitability. Depending on how much of these profits the company reinvests or "retains", and how effectively it does so, we are then able to assess a company’s earnings growth potential. Assuming all else is equal, companies that have both a higher return on equity and higher profit retention are usually the ones that have a higher growth rate when compared to companies that don't have the same features.
Kronos Worldwide's Earnings Growth And 18% ROE
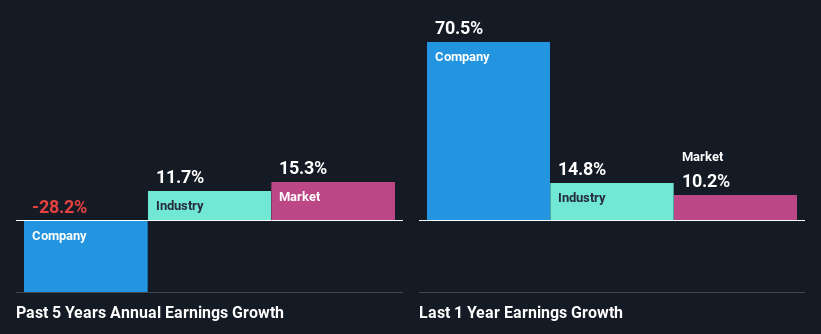
To begin with, Kronos Worldwide seems to have a respectable ROE. Even when compared to the industry average of 18% the company's ROE looks quite decent. However, while Kronos Worldwide has a pretty respectable ROE, its five year net income decline rate was 28% . We reckon that there could be some other factors at play here that are preventing the company's growth. These include low earnings retention or poor allocation of capital.
However, when we compared Kronos Worldwide's growth with the industry we found that while the company's earnings have been shrinking, the industry has seen an earnings growth of 12% in the same period. This is quite worrisome.
Earnings growth is a huge factor in stock valuation. What investors need to determine next is if the expected earnings growth, or the lack of it, is already built into the share price. By doing so, they will have an idea if the stock is headed into clear blue waters or if swampy waters await. Has the market priced in the future outlook for KRO? You can find out in our latest intrinsic value infographic research report.
Is Kronos Worldwide Using Its Retained Earnings Effectively?
Kronos Worldwide has a high three-year median payout ratio of 96% (that is, it is retaining 4.3% of its profits). This suggests that the company is paying most of its profits as dividends to its shareholders. This goes some way in explaining why its earnings have been shrinking. With only very little left to reinvest into the business, growth in earnings is far from likely. Our risks dashboard should have the 2 risks we have identified for Kronos Worldwide.
Additionally, Kronos Worldwide has paid dividends over a period of at least ten years, which means that the company's management is determined to pay dividends even if it means little to no earnings growth. Our latest analyst data shows that the future payout ratio of the company over the next three years is expected to be approximately 77%.
Summary
Overall, we have mixed feelings about Kronos Worldwide. In spite of the high ROE, the company has failed to see growth in its earnings due to it paying out most of its profits as dividend, with almost nothing left to invest into its own business. Until now, we have only just grazed the surface of the company's past performance by looking at the company's fundamentals. You can do your own research on Kronos Worldwide and see how it has performed in the past by looking at this FREE detailed graph of past earnings, revenue and cash flows.
Have feedback on this article? Concerned about the content? Get in touch with us directly. Alternatively, email editorial-team (at) simplywallst.com.
This article by Simply Wall St is general in nature. We provide commentary based on historical data and analyst forecasts only using an unbiased methodology and our articles are not intended to be financial advice. It does not constitute a recommendation to buy or sell any stock, and does not take account of your objectives, or your financial situation. We aim to bring you long-term focused analysis driven by fundamental data. Note that our analysis may not factor in the latest price-sensitive company announcements or qualitative material. Simply Wall St has no position in any stocks mentioned.
Join A Paid User Research Session
You’ll receive a US$30 Amazon Gift card for 1 hour of your time while helping us build better investing tools for the individual investors like yourself. Sign up here
