
 Yahoo Finance
 Market is not liking Perpetual's (ASX:PPT) earnings decline as stock retreats 6.0% this week
Ideally, your overall portfolio should beat the market average. But in any portfolio, there will be mixed results between individual stocks. At this point some shareholders may be questioning their investment in Perpetual Limited (ASX:PPT), since the last five years saw the share price fall 26%. The falls have accelerated recently, with the share price down 18% in the last three months.
With the stock having lost 6.0% in the past week, it's worth taking a look at business performance and seeing if there's any red flags.
See our latest analysis for Perpetual
There is no denying that markets are sometimes efficient, but prices do not always reflect underlying business performance. One imperfect but simple way to consider how the market perception of a company has shifted is to compare the change in the earnings per share (EPS) with the share price movement.
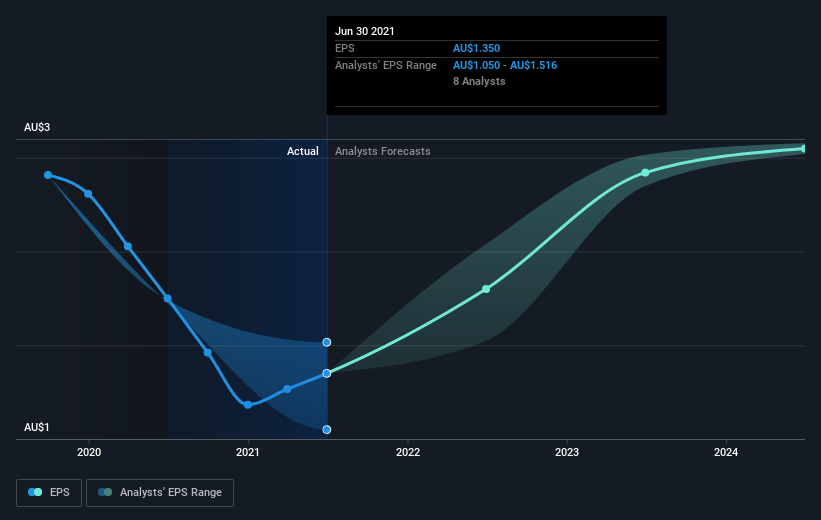
During the five years over which the share price declined, Perpetual's earnings per share (EPS) dropped by 14% each year. The share price decline of 6% per year isn't as bad as the EPS decline. The relatively muted share price reaction might be because the market expects the business to turn around.
You can see how EPS has changed over time in the image below (click on the chart to see the exact values).
We consider it positive that insiders have made significant purchases in the last year. Even so, future earnings will be far more important to whether current shareholders make money. This free interactive report on Perpetual's earnings, revenue and cash flow is a great place to start, if you want to investigate the stock further.
What About Dividends?
When looking at investment returns, it is important to consider the difference between total shareholder return (TSR) and share price return. The TSR incorporates the value of any spin-offs or discounted capital raisings, along with any dividends, based on the assumption that the dividends are reinvested. Arguably, the TSR gives a more comprehensive picture of the return generated by a stock. In the case of Perpetual, it has a TSR of -3.2% for the last 5 years. That exceeds its share price return that we previously mentioned. The dividends paid by the company have thusly boosted the total shareholder return.
A Different Perspective
Perpetual shareholders gained a total return of 5.7% during the year. But that return falls short of the market. On the bright side, that's still a gain, and it is certainly better than the yearly loss of about 0.6% endured over half a decade. It could well be that the business is stabilizing. While it is well worth considering the different impacts that market conditions can have on the share price, there are other factors that are even more important. Consider for instance, the ever-present spectre of investment risk. We've identified 2 warning signs with Perpetual , and understanding them should be part of your investment process.
If you like to buy stocks alongside management, then you might just love this free list of companies. (Hint: insiders have been buying them).
Please note, the market returns quoted in this article reflect the market weighted average returns of stocks that currently trade on AU exchanges.
This article by Simply Wall St is general in nature. We provide commentary based on historical data and analyst forecasts only using an unbiased methodology and our articles are not intended to be financial advice. It does not constitute a recommendation to buy or sell any stock, and does not take account of your objectives, or your financial situation. We aim to bring you long-term focused analysis driven by fundamental data. Note that our analysis may not factor in the latest price-sensitive company announcements or qualitative material. Simply Wall St has no position in any stocks mentioned.
Have feedback on this article? Concerned about the content? Get in touch with us directly. Alternatively, email editorial-team (at) simplywallst.com.
