
 Yahoo Finance
 Market Cool On Tesserent Limited's (ASX:TNT) Revenues
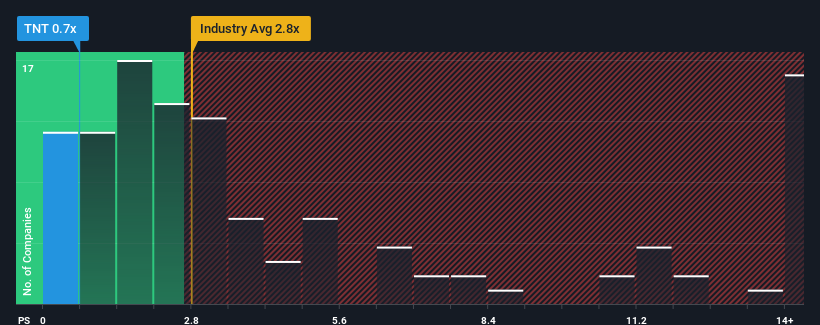
Tesserent Limited's (ASX:TNT) price-to-sales (or "P/S") ratio of 0.7x might make it look like a strong buy right now compared to the Software industry in Australia, where around half of the companies have P/S ratios above 2.8x and even P/S above 7x are quite common. Although, it's not wise to just take the P/S at face value as there may be an explanation why it's so limited.
Check out our latest analysis for Tesserent
How Has Tesserent Performed Recently?
Tesserent certainly has been doing a good job lately as it's been growing revenue more than most other companies. It might be that many expect the strong revenue performance to degrade substantially, which has repressed the share price, and thus the P/S ratio. If you like the company, you'd be hoping this isn't the case so that you could potentially pick up some stock while it's out of favour.
Keen to find out how analysts think Tesserent's future stacks up against the industry? In that case, our free report is a great place to start.
Is There Any Revenue Growth Forecasted For Tesserent?
The only time you'd be truly comfortable seeing a P/S as depressed as Tesserent's is when the company's growth is on track to lag the industry decidedly.
If we review the last year of revenue growth, the company posted a terrific increase of 59%. This great performance means it was also able to deliver immense revenue growth over the last three years. Therefore, it's fair to say the revenue growth recently has been superb for the company.
Looking ahead now, revenue is anticipated to climb by 23% during the coming year according to the lone analyst following the company. With the industry predicted to deliver 23% growth , the company is positioned for a comparable revenue result.
With this in consideration, we find it intriguing that Tesserent's P/S is lagging behind its industry peers. It may be that most investors are not convinced the company can achieve future growth expectations.
What Does Tesserent's P/S Mean For Investors?
Using the price-to-sales ratio alone to determine if you should sell your stock isn't sensible, however it can be a practical guide to the company's future prospects.
We've seen that Tesserent currently trades on a lower than expected P/S since its forecast growth is in line with the wider industry. When we see middle-of-the-road revenue growth like this, we assume it must be the potential risks that are what is placing pressure on the P/S ratio. However, if you agree with the analysts' forecasts, you may be able to pick up the stock at an attractive price.
Before you take the next step, you should know about the 2 warning signs for Tesserent that we have uncovered.
If companies with solid past earnings growth is up your alley, you may wish to see this free collection of other companies with strong earnings growth and low P/E ratios.
Have feedback on this article? Concerned about the content? Get in touch with us directly. Alternatively, email editorial-team (at) simplywallst.com.
This article by Simply Wall St is general in nature. We provide commentary based on historical data and analyst forecasts only using an unbiased methodology and our articles are not intended to be financial advice. It does not constitute a recommendation to buy or sell any stock, and does not take account of your objectives, or your financial situation. We aim to bring you long-term focused analysis driven by fundamental data. Note that our analysis may not factor in the latest price-sensitive company announcements or qualitative material. Simply Wall St has no position in any stocks mentioned.
Join A Paid User Research Session
You’ll receive a US$30 Amazon Gift card for 1 hour of your time while helping us build better investing tools for the individual investors like yourself. Sign up here