
 Yahoo Finance
 Manchester United's (NYSE:MANU) investors will be pleased with their notable 59% return over the last year
Manchester United plc (NYSE:MANU) shareholders might be concerned after seeing the share price drop 12% in the last month. But looking back over the last year, the returns have actually been rather pleasing! To wit, it had solidly beat the market, up 57%.
With that in mind, it's worth seeing if the company's underlying fundamentals have been the driver of long term performance, or if there are some discrepancies.
View our latest analysis for Manchester United
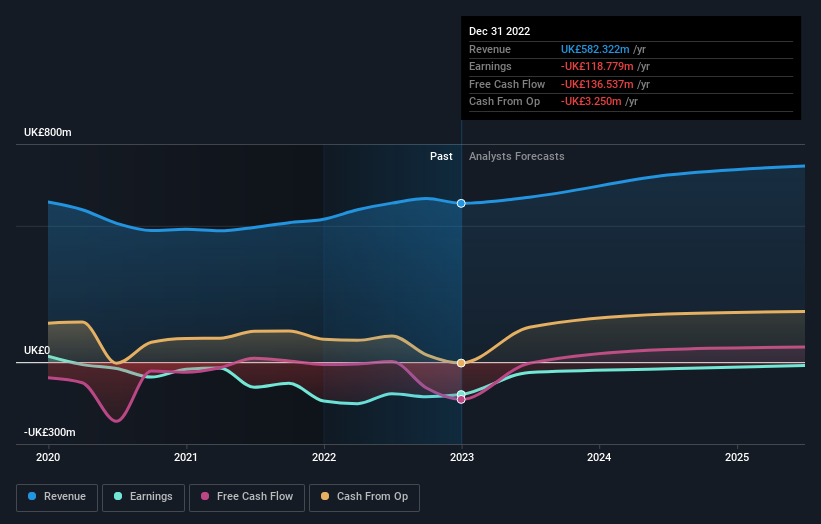
Manchester United wasn't profitable in the last twelve months, it is unlikely we'll see a strong correlation between its share price and its earnings per share (EPS). Arguably revenue is our next best option. When a company doesn't make profits, we'd generally expect to see good revenue growth. As you can imagine, fast revenue growth, when maintained, often leads to fast profit growth.
In the last year Manchester United saw its revenue grow by 11%. That's not great considering the company is losing money. The modest growth is probably largely reflected in the share price, which is up 57%. While not a huge gain tht seems pretty reasonable. It could be worth keeping an eye on this one, especially if growth accelerates.
The company's revenue and earnings (over time) are depicted in the image below (click to see the exact numbers).
Balance sheet strength is crucial. It might be well worthwhile taking a look at our free report on how its financial position has changed over time.
A Different Perspective
We're pleased to report that Manchester United shareholders have received a total shareholder return of 59% over one year. Of course, that includes the dividend. Since the one-year TSR is better than the five-year TSR (the latter coming in at 3% per year), it would seem that the stock's performance has improved in recent times. In the best case scenario, this may hint at some real business momentum, implying that now could be a great time to delve deeper. It's always interesting to track share price performance over the longer term. But to understand Manchester United better, we need to consider many other factors. For instance, we've identified 2 warning signs for Manchester United that you should be aware of.
For those who like to find winning investments this free list of growing companies with recent insider purchasing, could be just the ticket.
Please note, the market returns quoted in this article reflect the market weighted average returns of stocks that currently trade on American exchanges.
Have feedback on this article? Concerned about the content? Get in touch with us directly. Alternatively, email editorial-team (at) simplywallst.com.
This article by Simply Wall St is general in nature. We provide commentary based on historical data and analyst forecasts only using an unbiased methodology and our articles are not intended to be financial advice. It does not constitute a recommendation to buy or sell any stock, and does not take account of your objectives, or your financial situation. We aim to bring you long-term focused analysis driven by fundamental data. Note that our analysis may not factor in the latest price-sensitive company announcements or qualitative material. Simply Wall St has no position in any stocks mentioned.
Join A Paid User Research Session
You’ll receive a US$30 Amazon Gift card for 1 hour of your time while helping us build better investing tools for the individual investors like yourself. Sign up here
