
 Yahoo Finance
 Here’s What MAM Software Group, Inc.’s (NASDAQ:MAMS) P/E Ratio Is Telling Us

Want to participate in a research study? Help shape the future of investing tools and earn a $60 gift card!
This article is written for those who want to get better at using price to earnings ratios (P/E ratios). We’ll look at MAM Software Group, Inc.’s (NASDAQ:MAMS) P/E ratio and reflect on what it tells us about the company’s share price. MAM Software Group has a price to earnings ratio of 24.97, based on the last twelve months. That is equivalent to an earnings yield of about 4.0%.
Check out our latest analysis for MAM Software Group
How Do I Calculate A Price To Earnings Ratio?
The formula for P/E is:
Price to Earnings Ratio = Price per Share ÷ Earnings per Share (EPS)
Or for MAM Software Group:
P/E of 24.97 = $8.5 ÷ $0.34 (Based on the year to December 2018.)
Is A High P/E Ratio Good?
A higher P/E ratio means that buyers have to pay a higher price for each $1 the company has earned over the last year. That isn’t necessarily good or bad, but a high P/E implies relatively high expectations of what a company can achieve in the future.
How Growth Rates Impact P/E Ratios
Probably the most important factor in determining what P/E a company trades on is the earnings growth. When earnings grow, the ‘E’ increases, over time. Therefore, even if you pay a high multiple of earnings now, that multiple will become lower in the future. Then, a lower P/E should attract more buyers, pushing the share price up.
MAM Software Group’s earnings per share fell by 3.3% in the last twelve months. But it has grown its earnings per share by 17% per year over the last five years.
How Does MAM Software Group’s P/E Ratio Compare To Its Peers?
We can get an indication of market expectations by looking at the P/E ratio. If you look at the image below, you can see MAM Software Group has a lower P/E than the average (52) in the software industry classification.
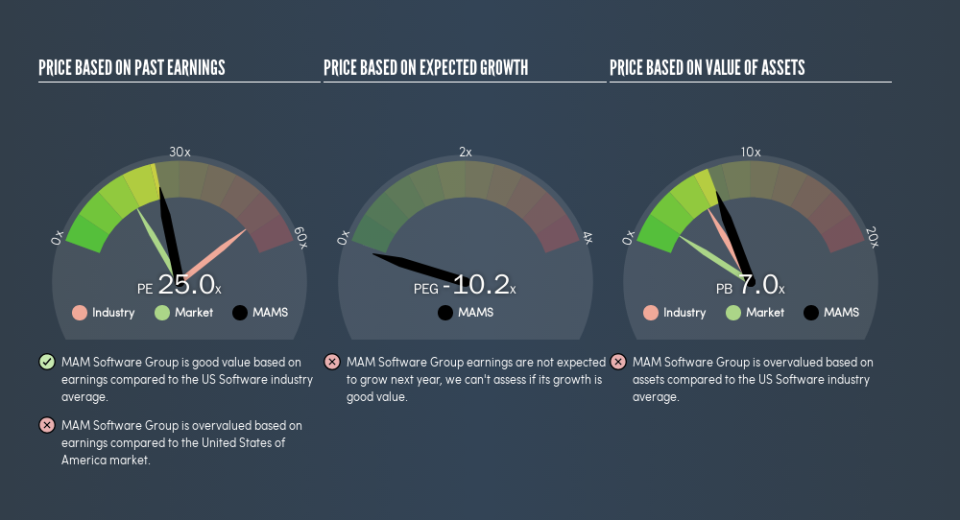
MAM Software Group’s P/E tells us that market participants think it will not fare as well as its peers in the same industry. Many investors like to buy stocks when the market is pessimistic about their prospects. You should delve deeper. I like to check if company insiders have been buying or selling.
A Limitation: P/E Ratios Ignore Debt and Cash In The Bank
Don’t forget that the P/E ratio considers market capitalization. In other words, it does not consider any debt or cash that the company may have on the balance sheet. Theoretically, a business can improve its earnings (and produce a lower P/E in the future), by taking on debt (or spending its remaining cash).
Spending on growth might be good or bad a few years later, but the point is that the P/E ratio does not account for the option (or lack thereof).
How Does MAM Software Group’s Debt Impact Its P/E Ratio?
Net debt totals just 1.6% of MAM Software Group’s market cap. So it doesn’t have as many options as it would with net cash, but its debt would not have much of an impact on its P/E ratio.
The Verdict On MAM Software Group’s P/E Ratio
MAM Software Group trades on a P/E ratio of 25, which is above the US market average of 17.2. With modest debt but no EPS growth in the last year, it’s fair to say the P/E implies some optimism about future earnings, from the market.
Investors have an opportunity when market expectations about a stock are wrong. People often underestimate remarkable growth — so investors can make money when fast growth is not fully appreciated. So this free visual report on analyst forecasts could hold the key to an excellent investment decision.
Of course you might be able to find a better stock than MAM Software Group. So you may wish to see this free collection of other companies that have grown earnings strongly.
We aim to bring you long-term focused research analysis driven by fundamental data. Note that our analysis may not factor in the latest price-sensitive company announcements or qualitative material.
If you spot an error that warrants correction, please contact the editor at editorial-team@simplywallst.com. This article by Simply Wall St is general in nature. It does not constitute a recommendation to buy or sell any stock, and does not take account of your objectives, or your financial situation. Simply Wall St has no position in the stocks mentioned. Thank you for reading.