
 Yahoo Finance
 MACOM Technology Solutions Holdings' (NASDAQ:MTSI) investors will be pleased with their impressive 141% return over the last five years
MACOM Technology Solutions Holdings, Inc. (NASDAQ:MTSI) shareholders might be concerned after seeing the share price drop 16% in the last quarter. But that scarcely detracts from the really solid long term returns generated by the company over five years. Indeed, the share price is up an impressive 141% in that time. We think it's more important to dwell on the long term returns than the short term returns. Only time will tell if there is still too much optimism currently reflected in the share price.
So let's assess the underlying fundamentals over the last 5 years and see if they've moved in lock-step with shareholder returns.
Check out our latest analysis for MACOM Technology Solutions Holdings
To paraphrase Benjamin Graham: Over the short term the market is a voting machine, but over the long term it's a weighing machine. One imperfect but simple way to consider how the market perception of a company has shifted is to compare the change in the earnings per share (EPS) with the share price movement.
During the five years of share price growth, MACOM Technology Solutions Holdings moved from a loss to profitability. That kind of transition can be an inflection point that justifies a strong share price gain, just as we have seen here.
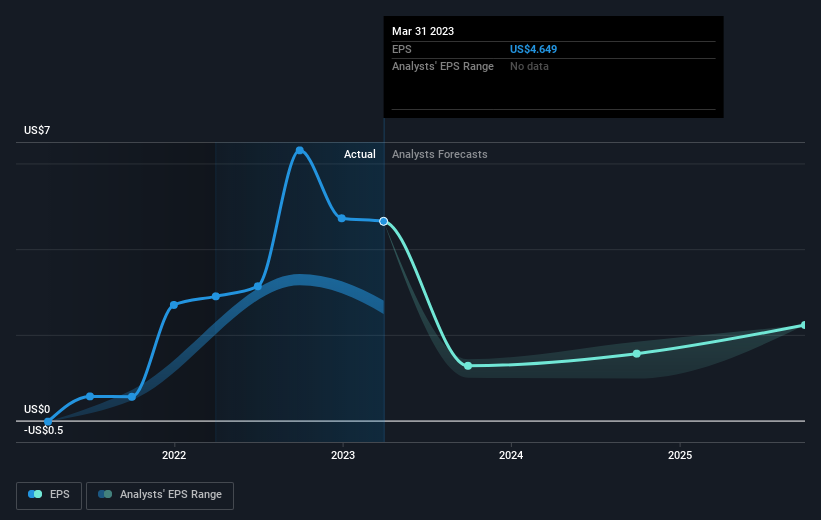
You can see how EPS has changed over time in the image below (click on the chart to see the exact values).
It is of course excellent to see how MACOM Technology Solutions Holdings has grown profits over the years, but the future is more important for shareholders. It might be well worthwhile taking a look at our free report on how its financial position has changed over time.
A Different Perspective
We're pleased to report that MACOM Technology Solutions Holdings shareholders have received a total shareholder return of 12% over one year. Having said that, the five-year TSR of 19% a year, is even better. The pessimistic view would be that be that the stock has its best days behind it, but on the other hand the price might simply be moderating while the business itself continues to execute. I find it very interesting to look at share price over the long term as a proxy for business performance. But to truly gain insight, we need to consider other information, too. Even so, be aware that MACOM Technology Solutions Holdings is showing 2 warning signs in our investment analysis , you should know about...
If you like to buy stocks alongside management, then you might just love this free list of companies. (Hint: insiders have been buying them).
Please note, the market returns quoted in this article reflect the market weighted average returns of stocks that currently trade on American exchanges.
Have feedback on this article? Concerned about the content? Get in touch with us directly. Alternatively, email editorial-team (at) simplywallst.com.
This article by Simply Wall St is general in nature. We provide commentary based on historical data and analyst forecasts only using an unbiased methodology and our articles are not intended to be financial advice. It does not constitute a recommendation to buy or sell any stock, and does not take account of your objectives, or your financial situation. We aim to bring you long-term focused analysis driven by fundamental data. Note that our analysis may not factor in the latest price-sensitive company announcements or qualitative material. Simply Wall St has no position in any stocks mentioned.
Join A Paid User Research Session
You’ll receive a US$30 Amazon Gift card for 1 hour of your time while helping us build better investing tools for the individual investors like yourself. Sign up here
