
 Yahoo Finance
 MA Financial Group (ASX:MAF) Is Paying Out A Dividend Of A$0.06
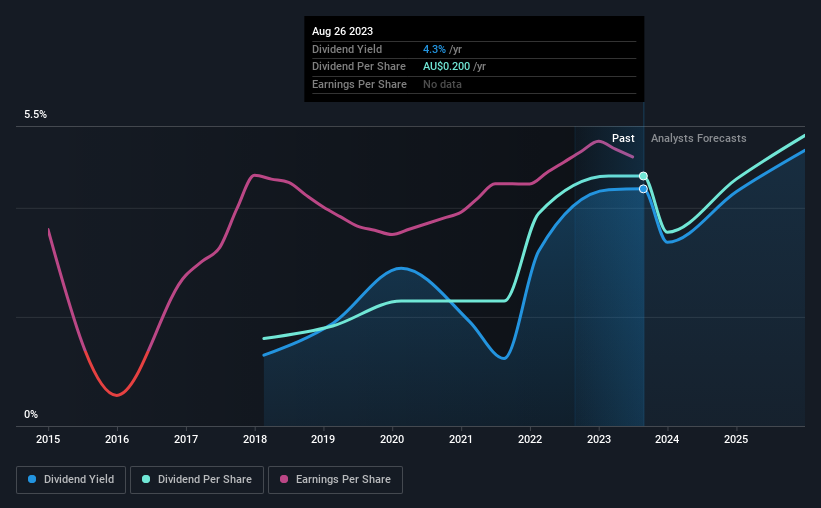
The board of MA Financial Group Limited (ASX:MAF) has announced that it will pay a dividend of A$0.06 per share on the 20th of September. This payment means that the dividend yield will be 4.3%, which is around the industry average.
Check out our latest analysis for MA Financial Group
MA Financial Group's Dividend Is Well Covered By Earnings
Unless the payments are sustainable, the dividend yield doesn't mean too much. The last dividend made up quite a large portion of free cash flows, and this was made worse by the lack of free cash flows. Generally, we think that this would be a risky long term practice.
Over the next year, EPS is forecast to expand by 62.6%. If the dividend continues along recent trends, we estimate the payout ratio will be 59%, which would make us comfortable with the sustainability of the dividend, despite the levels currently being quite high.
MA Financial Group Doesn't Have A Long Payment History
The dividend's track record has been pretty solid, but with only 5 years of history we want to see a few more years of history before making any solid conclusions. The dividend has gone from an annual total of A$0.07 in 2018 to the most recent total annual payment of A$0.20. This works out to be a compound annual growth rate (CAGR) of approximately 23% a year over that time. MA Financial Group has been growing its dividend quite rapidly, which is exciting. However, the short payment history makes us question whether this performance will persist across a full market cycle.
The Dividend's Growth Prospects Are Limited
Investors who have held shares in the company for the past few years will be happy with the dividend income they have received. Earnings per share has been crawling upwards at 2.6% per year. MA Financial Group's earnings per share has barely grown, which is not ideal - perhaps this is why the company pays out the majority of its earnings to shareholders. That's fine as far as it goes, but we're less enthusiastic as this often signals that the dividend is likely to grow slower in the future.
MA Financial Group's Dividend Doesn't Look Sustainable
Overall, it's nice to see a consistent dividend payment, but we think that longer term, the current level of payment might be unsustainable. The payments are bit high to be considered sustainable, and the track record isn't the best. This company is not in the top tier of income providing stocks.
It's important to note that companies having a consistent dividend policy will generate greater investor confidence than those having an erratic one. Meanwhile, despite the importance of dividend payments, they are not the only factors our readers should know when assessing a company. Case in point: We've spotted 3 warning signs for MA Financial Group (of which 2 don't sit too well with us!) you should know about. If you are a dividend investor, you might also want to look at our curated list of high yield dividend stocks.
Have feedback on this article? Concerned about the content? Get in touch with us directly. Alternatively, email editorial-team (at) simplywallst.com.
This article by Simply Wall St is general in nature. We provide commentary based on historical data and analyst forecasts only using an unbiased methodology and our articles are not intended to be financial advice. It does not constitute a recommendation to buy or sell any stock, and does not take account of your objectives, or your financial situation. We aim to bring you long-term focused analysis driven by fundamental data. Note that our analysis may not factor in the latest price-sensitive company announcements or qualitative material. Simply Wall St has no position in any stocks mentioned.
