
 Yahoo Finance
 MA Financial Group (ASX:MAF) shareholders have earned a 9.0% CAGR over the last five years
Stock pickers are generally looking for stocks that will outperform the broader market. And in our experience, buying the right stocks can give your wealth a significant boost. For example, the MA Financial Group Limited (ASX:MAF) share price is up 35% in the last 5 years, clearly besting the market return of around 28% (ignoring dividends). However, more recent returns haven't been as impressive as that, with the stock returning just 25% in the last year , including dividends .
With that in mind, it's worth seeing if the company's underlying fundamentals have been the driver of long term performance, or if there are some discrepancies.
See our latest analysis for MA Financial Group
In his essay The Superinvestors of Graham-and-Doddsville Warren Buffett described how share prices do not always rationally reflect the value of a business. One flawed but reasonable way to assess how sentiment around a company has changed is to compare the earnings per share (EPS) with the share price.
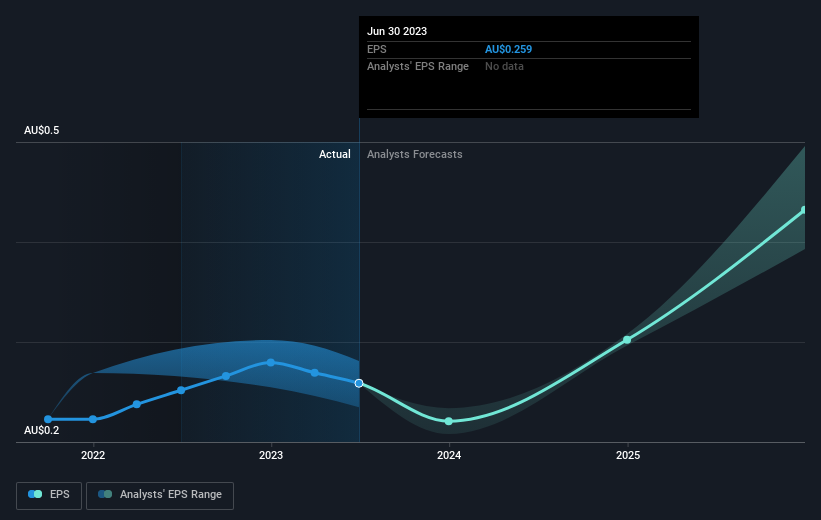
Over half a decade, MA Financial Group managed to grow its earnings per share at 2.6% a year. This EPS growth is lower than the 6% average annual increase in the share price. This suggests that market participants hold the company in higher regard, these days. That's not necessarily surprising considering the five-year track record of earnings growth.
The graphic below depicts how EPS has changed over time (unveil the exact values by clicking on the image).
We like that insiders have been buying shares in the last twelve months. Having said that, most people consider earnings and revenue growth trends to be a more meaningful guide to the business. This free interactive report on MA Financial Group's earnings, revenue and cash flow is a great place to start, if you want to investigate the stock further.
What About Dividends?
When looking at investment returns, it is important to consider the difference between total shareholder return (TSR) and share price return. The TSR incorporates the value of any spin-offs or discounted capital raisings, along with any dividends, based on the assumption that the dividends are reinvested. So for companies that pay a generous dividend, the TSR is often a lot higher than the share price return. As it happens, MA Financial Group's TSR for the last 5 years was 54%, which exceeds the share price return mentioned earlier. The dividends paid by the company have thusly boosted the total shareholder return.
A Different Perspective
We're pleased to report that MA Financial Group shareholders have received a total shareholder return of 25% over one year. And that does include the dividend. Since the one-year TSR is better than the five-year TSR (the latter coming in at 9% per year), it would seem that the stock's performance has improved in recent times. In the best case scenario, this may hint at some real business momentum, implying that now could be a great time to delve deeper. It's always interesting to track share price performance over the longer term. But to understand MA Financial Group better, we need to consider many other factors. Even so, be aware that MA Financial Group is showing 3 warning signs in our investment analysis , and 2 of those can't be ignored...
There are plenty of other companies that have insiders buying up shares. You probably do not want to miss this free list of growing companies that insiders are buying.
Please note, the market returns quoted in this article reflect the market weighted average returns of stocks that currently trade on Australian exchanges.
Have feedback on this article? Concerned about the content? Get in touch with us directly. Alternatively, email editorial-team (at) simplywallst.com.
This article by Simply Wall St is general in nature. We provide commentary based on historical data and analyst forecasts only using an unbiased methodology and our articles are not intended to be financial advice. It does not constitute a recommendation to buy or sell any stock, and does not take account of your objectives, or your financial situation. We aim to bring you long-term focused analysis driven by fundamental data. Note that our analysis may not factor in the latest price-sensitive company announcements or qualitative material. Simply Wall St has no position in any stocks mentioned.
