
 Yahoo Finance
 M.D.C. Holdings (NYSE:MDC) Has Gifted Shareholders With A Fantastic 171% Total Return On Their Investment

The worst result, after buying shares in a company (assuming no leverage), would be if you lose all the money you put in. But on the bright side, you can make far more than 100% on a really good stock. For example, the M.D.C. Holdings, Inc. (NYSE:MDC) share price has soared 127% in the last half decade. Most would be very happy with that. On top of that, the share price is up 13% in about a quarter. But this could be related to the strong market, which is up 8.9% in the last three months.
View our latest analysis for M.D.C. Holdings
To paraphrase Benjamin Graham: Over the short term the market is a voting machine, but over the long term it's a weighing machine. One imperfect but simple way to consider how the market perception of a company has shifted is to compare the change in the earnings per share (EPS) with the share price movement.
During five years of share price growth, M.D.C. Holdings achieved compound earnings per share (EPS) growth of 34% per year. This EPS growth is higher than the 18% average annual increase in the share price. So it seems the market isn't so enthusiastic about the stock these days. The reasonably low P/E ratio of 11.47 also suggests market apprehension.
You can see how EPS has changed over time in the image below (click on the chart to see the exact values).
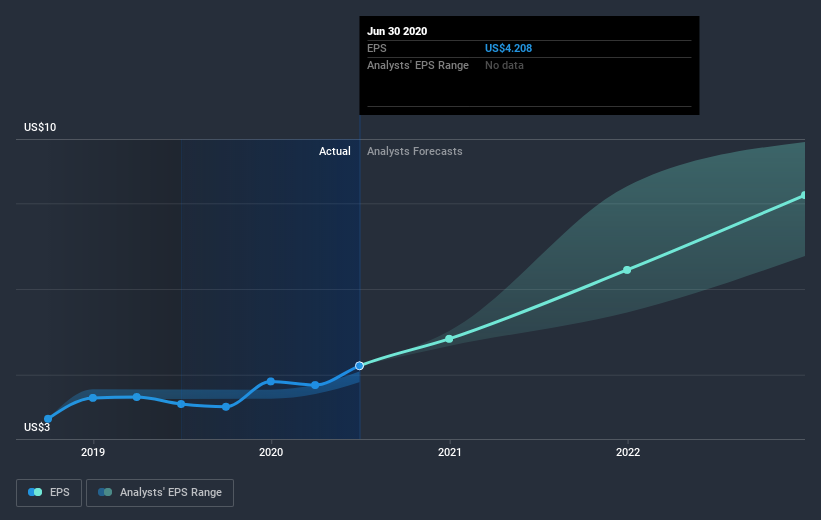
We know that M.D.C. Holdings has improved its bottom line lately, but is it going to grow revenue? You could check out this free report showing analyst revenue forecasts.
What About Dividends?
When looking at investment returns, it is important to consider the difference between total shareholder return (TSR) and share price return. Whereas the share price return only reflects the change in the share price, the TSR includes the value of dividends (assuming they were reinvested) and the benefit of any discounted capital raising or spin-off. It's fair to say that the TSR gives a more complete picture for stocks that pay a dividend. As it happens, M.D.C. Holdings' TSR for the last 5 years was 171%, which exceeds the share price return mentioned earlier. This is largely a result of its dividend payments!
A Different Perspective
M.D.C. Holdings shareholders are up 14% for the year (even including dividends). But that return falls short of the market. It's probably a good sign that the company has an even better long term track record, having provided shareholders with an annual TSR of 22% over five years. Maybe the share price is just taking a breather while the business executes on its growth strategy. It's always interesting to track share price performance over the longer term. But to understand M.D.C. Holdings better, we need to consider many other factors. Consider for instance, the ever-present spectre of investment risk. We've identified 3 warning signs with M.D.C. Holdings (at least 1 which is a bit concerning) , and understanding them should be part of your investment process.
If you would prefer to check out another company -- one with potentially superior financials -- then do not miss this free list of companies that have proven they can grow earnings.
Please note, the market returns quoted in this article reflect the market weighted average returns of stocks that currently trade on US exchanges.
This article by Simply Wall St is general in nature. It does not constitute a recommendation to buy or sell any stock, and does not take account of your objectives, or your financial situation. We aim to bring you long-term focused analysis driven by fundamental data. Note that our analysis may not factor in the latest price-sensitive company announcements or qualitative material. Simply Wall St has no position in any stocks mentioned.
Have feedback on this article? Concerned about the content? Get in touch with us directly. Alternatively, email editorial-team@simplywallst.com.
