
 Yahoo Finance
 Should LSB Industries, Inc. (NYSE:LXU) Focus On Improving This Fundamental Metric?
One of the best investments we can make is in our own knowledge and skill set. With that in mind, this article will work through how we can use Return On Equity (ROE) to better understand a business. To keep the lesson grounded in practicality, we'll use ROE to better understand LSB Industries, Inc. (NYSE:LXU).
ROE or return on equity is a useful tool to assess how effectively a company can generate returns on the investment it received from its shareholders. In simpler terms, it measures the profitability of a company in relation to shareholder's equity.
Check out our latest analysis for LSB Industries
How Is ROE Calculated?
ROE can be calculated by using the formula:
Return on Equity = Net Profit (from continuing operations) ÷ Shareholders' Equity
So, based on the above formula, the ROE for LSB Industries is:
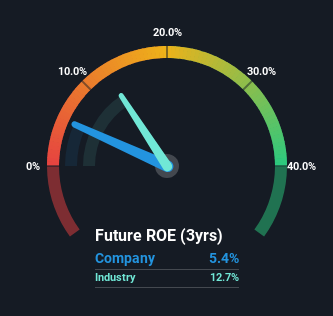
5.4% = US$28m ÷ US$518m (Based on the trailing twelve months to December 2023).
The 'return' is the amount earned after tax over the last twelve months. That means that for every $1 worth of shareholders' equity, the company generated $0.05 in profit.
Does LSB Industries Have A Good ROE?
By comparing a company's ROE with its industry average, we can get a quick measure of how good it is. Importantly, this is far from a perfect measure, because companies differ significantly within the same industry classification. As shown in the graphic below, LSB Industries has a lower ROE than the average (13%) in the Chemicals industry classification.
That certainly isn't ideal. That being said, a low ROE is not always a bad thing, especially if the company has low leverage as this still leaves room for improvement if the company were to take on more debt. A company with high debt levels and low ROE is a combination we like to avoid given the risk involved. To know the 3 risks we have identified for LSB Industries visit our risks dashboard for free.
Why You Should Consider Debt When Looking At ROE
Companies usually need to invest money to grow their profits. That cash can come from issuing shares, retained earnings, or debt. In the first and second cases, the ROE will reflect this use of cash for investment in the business. In the latter case, the debt used for growth will improve returns, but won't affect the total equity. That will make the ROE look better than if no debt was used.
LSB Industries' Debt And Its 5.4% ROE
It's worth noting the high use of debt by LSB Industries, leading to its debt to equity ratio of 1.15. The combination of a rather low ROE and significant use of debt is not particularly appealing. Investors should think carefully about how a company might perform if it was unable to borrow so easily, because credit markets do change over time.
Summary
Return on equity is a useful indicator of the ability of a business to generate profits and return them to shareholders. In our books, the highest quality companies have high return on equity, despite low debt. If two companies have around the same level of debt to equity, and one has a higher ROE, I'd generally prefer the one with higher ROE.
But when a business is high quality, the market often bids it up to a price that reflects this. Profit growth rates, versus the expectations reflected in the price of the stock, are a particularly important to consider. So I think it may be worth checking this free report on analyst forecasts for the company.
If you would prefer check out another company -- one with potentially superior financials -- then do not miss this free list of interesting companies, that have HIGH return on equity and low debt.
Have feedback on this article? Concerned about the content? Get in touch with us directly. Alternatively, email editorial-team (at) simplywallst.com.
This article by Simply Wall St is general in nature. We provide commentary based on historical data and analyst forecasts only using an unbiased methodology and our articles are not intended to be financial advice. It does not constitute a recommendation to buy or sell any stock, and does not take account of your objectives, or your financial situation. We aim to bring you long-term focused analysis driven by fundamental data. Note that our analysis may not factor in the latest price-sensitive company announcements or qualitative material. Simply Wall St has no position in any stocks mentioned.
