
 Yahoo Finance
 Lowe's Companies (NYSE:LOW) Is Investing Its Capital With Increasing Efficiency
If we want to find a stock that could multiply over the long term, what are the underlying trends we should look for? Firstly, we'll want to see a proven return on capital employed (ROCE) that is increasing, and secondly, an expanding base of capital employed. Basically this means that a company has profitable initiatives that it can continue to reinvest in, which is a trait of a compounding machine. With that in mind, the ROCE of Lowe's Companies (NYSE:LOW) looks great, so lets see what the trend can tell us.
What Is Return On Capital Employed (ROCE)?
For those who don't know, ROCE is a measure of a company's yearly pre-tax profit (its return), relative to the capital employed in the business. Analysts use this formula to calculate it for Lowe's Companies:
Return on Capital Employed = Earnings Before Interest and Tax (EBIT) ÷ (Total Assets - Current Liabilities)
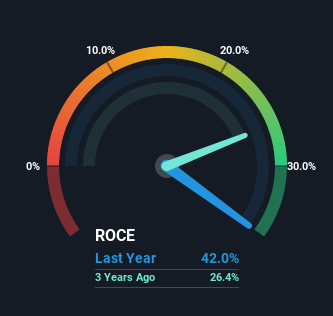
0.42 = US$10b ÷ (US$44b - US$20b) (Based on the trailing twelve months to February 2023).
So, Lowe's Companies has an ROCE of 42%. That's a fantastic return and not only that, it outpaces the average of 17% earned by companies in a similar industry.
See our latest analysis for Lowe's Companies
Above you can see how the current ROCE for Lowe's Companies compares to its prior returns on capital, but there's only so much you can tell from the past. If you'd like, you can check out the forecasts from the analysts covering Lowe's Companies here for free.
What Does the ROCE Trend For Lowe's Companies Tell Us?
Lowe's Companies has not disappointed with their ROCE growth. The figures show that over the last five years, ROCE has grown 48% whilst employing roughly the same amount of capital. Basically the business is generating higher returns from the same amount of capital and that is proof that there are improvements in the company's efficiencies. The company is doing well in that sense, and it's worth investigating what the management team has planned for long term growth prospects.
For the record though, there was a noticeable increase in the company's current liabilities over the period, so we would attribute some of the ROCE growth to that. The current liabilities has increased to 45% of total assets, so the business is now more funded by the likes of its suppliers or short-term creditors. Given it's pretty high ratio, we'd remind investors that having current liabilities at those levels can bring about some risks in certain businesses.
Our Take On Lowe's Companies' ROCE
To sum it up, Lowe's Companies is collecting higher returns from the same amount of capital, and that's impressive. And with the stock having performed exceptionally well over the last five years, these patterns are being accounted for by investors. With that being said, we still think the promising fundamentals mean the company deserves some further due diligence.
If you'd like to know more about Lowe's Companies, we've spotted 3 warning signs, and 1 of them is significant.
High returns are a key ingredient to strong performance, so check out our free list ofstocks earning high returns on equity with solid balance sheets.
Have feedback on this article? Concerned about the content? Get in touch with us directly. Alternatively, email editorial-team (at) simplywallst.com.
This article by Simply Wall St is general in nature. We provide commentary based on historical data and analyst forecasts only using an unbiased methodology and our articles are not intended to be financial advice. It does not constitute a recommendation to buy or sell any stock, and does not take account of your objectives, or your financial situation. We aim to bring you long-term focused analysis driven by fundamental data. Note that our analysis may not factor in the latest price-sensitive company announcements or qualitative material. Simply Wall St has no position in any stocks mentioned.
Join A Paid User Research Session
You’ll receive a US$30 Amazon Gift card for 1 hour of your time while helping us build better investing tools for the individual investors like yourself. Sign up here