
 Yahoo Finance
 Lovisa Holdings' (ASX:LOV) five-year total shareholder returns outpace the underlying earnings growth
The Lovisa Holdings Limited (ASX:LOV) share price has had a bad week, falling 11%. But that scarcely detracts from the really solid long term returns generated by the company over five years. Indeed, the share price is up an impressive 191% in that time. To some, the recent pullback wouldn't be surprising after such a fast rise. Of course, that doesn't necessarily mean it's cheap now.
Although Lovisa Holdings has shed AU$391m from its market cap this week, let's take a look at its longer term fundamental trends and see if they've driven returns.
View our latest analysis for Lovisa Holdings
There is no denying that markets are sometimes efficient, but prices do not always reflect underlying business performance. One imperfect but simple way to consider how the market perception of a company has shifted is to compare the change in the earnings per share (EPS) with the share price movement.
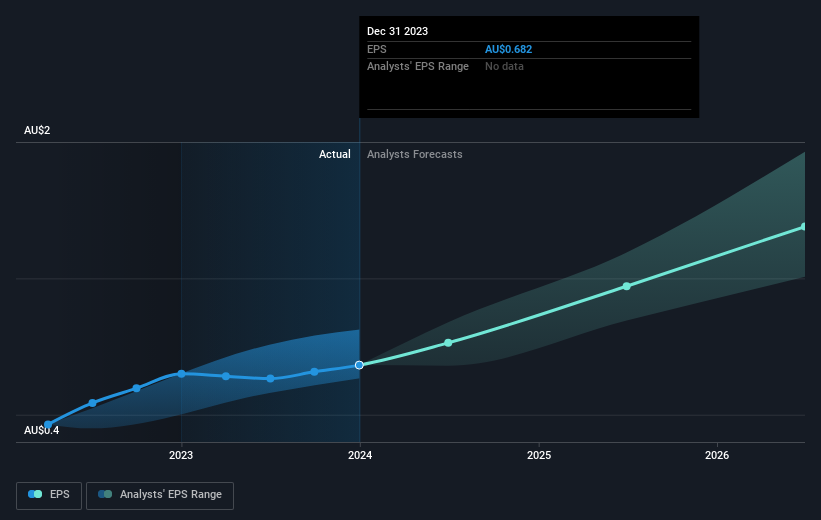
During five years of share price growth, Lovisa Holdings achieved compound earnings per share (EPS) growth of 14% per year. This EPS growth is lower than the 24% average annual increase in the share price. So it's fair to assume the market has a higher opinion of the business than it did five years ago. And that's hardly shocking given the track record of growth.
You can see below how EPS has changed over time (discover the exact values by clicking on the image).
It is of course excellent to see how Lovisa Holdings has grown profits over the years, but the future is more important for shareholders. Take a more thorough look at Lovisa Holdings' financial health with this free report on its balance sheet.
What About Dividends?
When looking at investment returns, it is important to consider the difference between total shareholder return (TSR) and share price return. The TSR incorporates the value of any spin-offs or discounted capital raisings, along with any dividends, based on the assumption that the dividends are reinvested. It's fair to say that the TSR gives a more complete picture for stocks that pay a dividend. In the case of Lovisa Holdings, it has a TSR of 234% for the last 5 years. That exceeds its share price return that we previously mentioned. This is largely a result of its dividend payments!
A Different Perspective
It's good to see that Lovisa Holdings has rewarded shareholders with a total shareholder return of 14% in the last twelve months. Of course, that includes the dividend. However, that falls short of the 27% TSR per annum it has made for shareholders, each year, over five years. The pessimistic view would be that be that the stock has its best days behind it, but on the other hand the price might simply be moderating while the business itself continues to execute. While it is well worth considering the different impacts that market conditions can have on the share price, there are other factors that are even more important. To that end, you should be aware of the 1 warning sign we've spotted with Lovisa Holdings .
But note: Lovisa Holdings may not be the best stock to buy. So take a peek at this free list of interesting companies with past earnings growth (and further growth forecast).
Please note, the market returns quoted in this article reflect the market weighted average returns of stocks that currently trade on Australian exchanges.
Have feedback on this article? Concerned about the content? Get in touch with us directly. Alternatively, email editorial-team (at) simplywallst.com.
This article by Simply Wall St is general in nature. We provide commentary based on historical data and analyst forecasts only using an unbiased methodology and our articles are not intended to be financial advice. It does not constitute a recommendation to buy or sell any stock, and does not take account of your objectives, or your financial situation. We aim to bring you long-term focused analysis driven by fundamental data. Note that our analysis may not factor in the latest price-sensitive company announcements or qualitative material. Simply Wall St has no position in any stocks mentioned.
