
 Yahoo Finance
 Lamb Weston Holdings (NYSE:LW) Is Reinvesting At Lower Rates Of Return
If we want to find a potential multi-bagger, often there are underlying trends that can provide clues. Firstly, we'd want to identify a growing return on capital employed (ROCE) and then alongside that, an ever-increasing base of capital employed. If you see this, it typically means it's a company with a great business model and plenty of profitable reinvestment opportunities. However, after investigating Lamb Weston Holdings (NYSE:LW), we don't think it's current trends fit the mold of a multi-bagger.
What Is Return On Capital Employed (ROCE)?
For those who don't know, ROCE is a measure of a company's yearly pre-tax profit (its return), relative to the capital employed in the business. The formula for this calculation on Lamb Weston Holdings is:
Return on Capital Employed = Earnings Before Interest and Tax (EBIT) ÷ (Total Assets - Current Liabilities)
0.13 = US$444m ÷ (US$4.1b - US$699m) (Based on the trailing twelve months to May 2022).
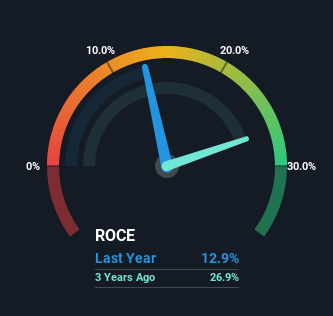
So, Lamb Weston Holdings has an ROCE of 13%. In absolute terms, that's a satisfactory return, but compared to the Food industry average of 10.0% it's much better.
See our latest analysis for Lamb Weston Holdings
In the above chart we have measured Lamb Weston Holdings' prior ROCE against its prior performance, but the future is arguably more important. If you're interested, you can view the analysts predictions in our free report on analyst forecasts for the company.
What Does the ROCE Trend For Lamb Weston Holdings Tell Us?
When we looked at the ROCE trend at Lamb Weston Holdings, we didn't gain much confidence. Over the last five years, returns on capital have decreased to 13% from 28% five years ago. Although, given both revenue and the amount of assets employed in the business have increased, it could suggest the company is investing in growth, and the extra capital has led to a short-term reduction in ROCE. And if the increased capital generates additional returns, the business, and thus shareholders, will benefit in the long run.
The Bottom Line On Lamb Weston Holdings' ROCE
Even though returns on capital have fallen in the short term, we find it promising that revenue and capital employed have both increased for Lamb Weston Holdings. And the stock has followed suit returning a meaningful 94% to shareholders over the last five years. So should these growth trends continue, we'd be optimistic on the stock going forward.
Lamb Weston Holdings does have some risks, we noticed 2 warning signs (and 1 which is potentially serious) we think you should know about.
While Lamb Weston Holdings isn't earning the highest return, check out this free list of companies that are earning high returns on equity with solid balance sheets.
Have feedback on this article? Concerned about the content? Get in touch with us directly. Alternatively, email editorial-team (at) simplywallst.com.
This article by Simply Wall St is general in nature. We provide commentary based on historical data and analyst forecasts only using an unbiased methodology and our articles are not intended to be financial advice. It does not constitute a recommendation to buy or sell any stock, and does not take account of your objectives, or your financial situation. We aim to bring you long-term focused analysis driven by fundamental data. Note that our analysis may not factor in the latest price-sensitive company announcements or qualitative material. Simply Wall St has no position in any stocks mentioned.
Join A Paid User Research Session
You’ll receive a US$30 Amazon Gift card for 1 hour of your time while helping us build better investing tools for the individual investors like yourself. Sign up here
