
 Yahoo Finance
 Kraken Robotics (CVE:PNG) Is Experiencing Growth In Returns On Capital
What trends should we look for it we want to identify stocks that can multiply in value over the long term? Typically, we'll want to notice a trend of growing return on capital employed (ROCE) and alongside that, an expanding base of capital employed. This shows us that it's a compounding machine, able to continually reinvest its earnings back into the business and generate higher returns. So on that note, Kraken Robotics (CVE:PNG) looks quite promising in regards to its trends of return on capital.
Return On Capital Employed (ROCE): What Is It?
If you haven't worked with ROCE before, it measures the 'return' (pre-tax profit) a company generates from capital employed in its business. To calculate this metric for Kraken Robotics, this is the formula:
Return on Capital Employed = Earnings Before Interest and Tax (EBIT) ÷ (Total Assets - Current Liabilities)
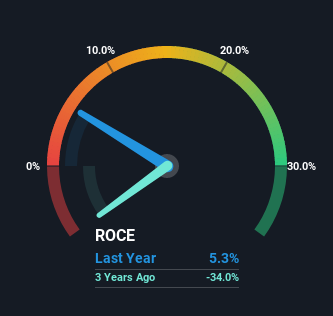
0.053 = CA$1.7m ÷ (CA$65m - CA$33m) (Based on the trailing twelve months to September 2022).
Thus, Kraken Robotics has an ROCE of 5.3%. Ultimately, that's a low return and it under-performs the Electronic industry average of 19%.
Check out our latest analysis for Kraken Robotics
Above you can see how the current ROCE for Kraken Robotics compares to its prior returns on capital, but there's only so much you can tell from the past. If you'd like to see what analysts are forecasting going forward, you should check out our free report for Kraken Robotics.
What The Trend Of ROCE Can Tell Us
We're delighted to see that Kraken Robotics is reaping rewards from its investments and is now generating some pre-tax profits. Shareholders would no doubt be pleased with this because the business was loss-making five years ago but is is now generating 5.3% on its capital. In addition to that, Kraken Robotics is employing 2,967% more capital than previously which is expected of a company that's trying to break into profitability. This can tell us that the company has plenty of reinvestment opportunities that are able to generate higher returns.
One more thing to note, Kraken Robotics has decreased current liabilities to 50% of total assets over this period, which effectively reduces the amount of funding from suppliers or short-term creditors. So shareholders would be pleased that the growth in returns has mostly come from underlying business performance. However, current liabilities are still at a pretty high level, so just be aware that this can bring with it some risks.
In Conclusion...
Overall, Kraken Robotics gets a big tick from us thanks in most part to the fact that it is now profitable and is reinvesting in its business. And with the stock having performed exceptionally well over the last five years, these patterns are being accounted for by investors. With that being said, we still think the promising fundamentals mean the company deserves some further due diligence.
If you want to continue researching Kraken Robotics, you might be interested to know about the 2 warning signs that our analysis has discovered.
While Kraken Robotics may not currently earn the highest returns, we've compiled a list of companies that currently earn more than 25% return on equity. Check out this free list here.
Have feedback on this article? Concerned about the content? Get in touch with us directly. Alternatively, email editorial-team (at) simplywallst.com.
This article by Simply Wall St is general in nature. We provide commentary based on historical data and analyst forecasts only using an unbiased methodology and our articles are not intended to be financial advice. It does not constitute a recommendation to buy or sell any stock, and does not take account of your objectives, or your financial situation. We aim to bring you long-term focused analysis driven by fundamental data. Note that our analysis may not factor in the latest price-sensitive company announcements or qualitative material. Simply Wall St has no position in any stocks mentioned.
Join A Paid User Research Session
You’ll receive a US$30 Amazon Gift card for 1 hour of your time while helping us build better investing tools for the individual investors like yourself. Sign up here
