
 Yahoo Finance
 Kogan.com (ASX:KGN) May Have Issues Allocating Its Capital
What trends should we look for it we want to identify stocks that can multiply in value over the long term? One common approach is to try and find a company with returns on capital employed (ROCE) that are increasing, in conjunction with a growing amount of capital employed. Ultimately, this demonstrates that it's a business that is reinvesting profits at increasing rates of return. However, after investigating Kogan.com (ASX:KGN), we don't think it's current trends fit the mold of a multi-bagger.
What Is Return On Capital Employed (ROCE)?
For those who don't know, ROCE is a measure of a company's yearly pre-tax profit (its return), relative to the capital employed in the business. The formula for this calculation on Kogan.com is:
Return on Capital Employed = Earnings Before Interest and Tax (EBIT) ÷ (Total Assets - Current Liabilities)
0.033 = AU$5.9m ÷ (AU$298m - AU$121m) (Based on the trailing twelve months to December 2023).
So, Kogan.com has an ROCE of 3.3%. In absolute terms, that's a low return and it also under-performs the Multiline Retail industry average of 9.6%.
See our latest analysis for Kogan.com
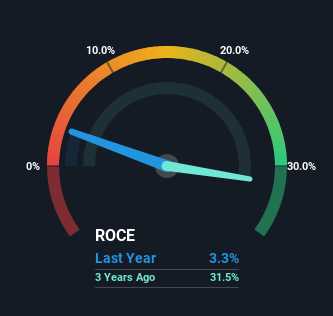
Above you can see how the current ROCE for Kogan.com compares to its prior returns on capital, but there's only so much you can tell from the past. If you'd like to see what analysts are forecasting going forward, you should check out our free analyst report for Kogan.com .
What Does the ROCE Trend For Kogan.com Tell Us?
On the surface, the trend of ROCE at Kogan.com doesn't inspire confidence. To be more specific, ROCE has fallen from 37% over the last five years. Given the business is employing more capital while revenue has slipped, this is a bit concerning. This could mean that the business is losing its competitive advantage or market share, because while more money is being put into ventures, it's actually producing a lower return - "less bang for their buck" per se.
On a related note, Kogan.com has decreased its current liabilities to 40% of total assets. That could partly explain why the ROCE has dropped. Effectively this means their suppliers or short-term creditors are funding less of the business, which reduces some elements of risk. Some would claim this reduces the business' efficiency at generating ROCE since it is now funding more of the operations with its own money. Either way, they're still at a pretty high level, so we'd like to see them fall further if possible.
The Bottom Line On Kogan.com's ROCE
From the above analysis, we find it rather worrisome that returns on capital and sales for Kogan.com have fallen, meanwhile the business is employing more capital than it was five years ago. Since the stock has skyrocketed 114% over the last five years, it looks like investors have high expectations of the stock. Regardless, we don't feel too comfortable with the fundamentals so we'd be steering clear of this stock for now.
On a final note, we've found 1 warning sign for Kogan.com that we think you should be aware of.
If you want to search for solid companies with great earnings, check out this free list of companies with good balance sheets and impressive returns on equity.
Have feedback on this article? Concerned about the content? Get in touch with us directly. Alternatively, email editorial-team (at) simplywallst.com.
This article by Simply Wall St is general in nature. We provide commentary based on historical data and analyst forecasts only using an unbiased methodology and our articles are not intended to be financial advice. It does not constitute a recommendation to buy or sell any stock, and does not take account of your objectives, or your financial situation. We aim to bring you long-term focused analysis driven by fundamental data. Note that our analysis may not factor in the latest price-sensitive company announcements or qualitative material. Simply Wall St has no position in any stocks mentioned.
