
 Yahoo Finance
 Do You Know What SRG Global Limited’s (ASX:SRG) P/E Ratio Means?

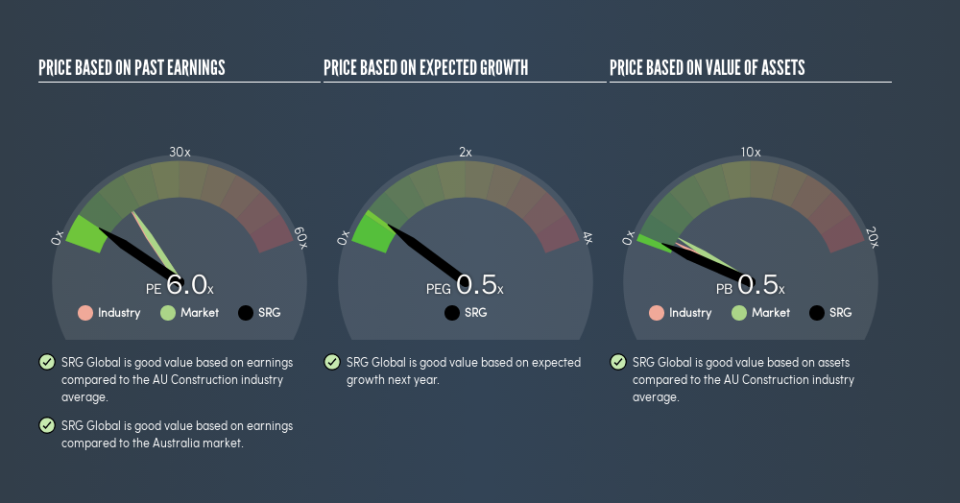
This article is for investors who would like to improve their understanding of price to earnings ratios (P/E ratios). We’ll look at SRG Global Limited’s (ASX:SRG) P/E ratio and reflect on what it tells us about the company’s share price. Based on the last twelve months, SRG Global’s P/E ratio is 5.98. In other words, at today’s prices, investors are paying A$5.98 for every A$1 in prior year profit.
Check out our latest analysis for SRG Global
How Do I Calculate A Price To Earnings Ratio?
The formula for P/E is:
Price to Earnings Ratio = Price per Share ÷ Earnings per Share (EPS)
Or for SRG Global:
P/E of 5.98 = A$0.36 ÷ A$0.060 (Based on the year to June 2018.)
Is A High P/E Ratio Good?
A higher P/E ratio means that buyers have to pay a higher price for each A$1 the company has earned over the last year. That isn’t necessarily good or bad, but a high P/E implies relatively high expectations of what a company can achieve in the future.
How Growth Rates Impact P/E Ratios
Probably the most important factor in determining what P/E a company trades on is the earnings growth. Earnings growth means that in the future the ‘E’ will be higher. That means unless the share price increases, the P/E will reduce in a few years. A lower P/E should indicate the stock is cheap relative to others — and that may attract buyers.
SRG Global increased earnings per share by 2.5% last year. And it has improved its earnings per share by 29% per year over the last three years. Unfortunately, earnings per share are down 27% a year, over 5 years.
How Does SRG Global’s P/E Ratio Compare To Its Peers?
The P/E ratio indicates whether the market has higher or lower expectations of a company. The image below shows that SRG Global has a lower P/E than the average (15.4) P/E for companies in the construction industry.
Its relatively low P/E ratio indicates that SRG Global shareholders think it will struggle to do as well as other companies in its industry classification. Many investors like to buy stocks when the market is pessimistic about their prospects. It is arguably worth checking if insiders are buying shares, because that might imply they believe the stock is undervalued.
Don’t Forget: The P/E Does Not Account For Debt or Bank Deposits
Don’t forget that the P/E ratio considers market capitalization. Thus, the metric does not reflect cash or debt held by the company. In theory, a company can lower its future P/E ratio by using cash or debt to invest in growth.
Spending on growth might be good or bad a few years later, but the point is that the P/E ratio does not account for the option (or lack thereof).
SRG Global’s Balance Sheet
Since SRG Global holds net cash of AU$35m, it can spend on growth, justifying a higher P/E ratio than otherwise.
The Bottom Line On SRG Global’s P/E Ratio
SRG Global’s P/E is 6 which is below average (15.8) in the AU market. Recent earnings growth wasn’t bad. Also positive, the relatively strong balance sheet will allow for investment in growth. In contrast, the P/E indicates shareholders doubt that will happen!
Investors should be looking to buy stocks that the market is wrong about. As value investor Benjamin Graham famously said, ‘In the short run, the market is a voting machine but in the long run, it is a weighing machine.’ So this free visualization of the analyst consensus on future earnings could help you make the right decision about whether to buy, sell, or hold.
Of course, you might find a fantastic investment by looking at a few good candidates. So take a peek at this free list of companies with modest (or no) debt, trading on a P/E below 20.
We aim to bring you long-term focused research analysis driven by fundamental data. Note that our analysis may not factor in the latest price-sensitive company announcements or qualitative material.
If you spot an error that warrants correction, please contact the editor at editorial-team@simplywallst.com. This article by Simply Wall St is general in nature. It does not constitute a recommendation to buy or sell any stock, and does not take account of your objectives, or your financial situation. Simply Wall St has no position in the stocks mentioned. Thank you for reading.
