
 Yahoo Finance
 Do You Know What Macmahon Holdings Limited’s (ASX:MAH) P/E Ratio Means?

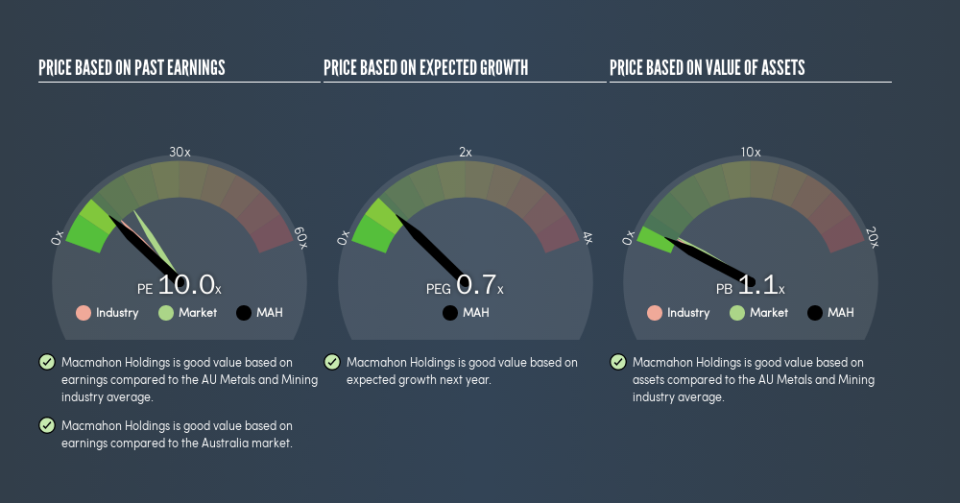
This article is written for those who want to get better at using price to earnings ratios (P/E ratios). We’ll look at Macmahon Holdings Limited’s (ASX:MAH) P/E ratio and reflect on what it tells us about the company’s share price. Macmahon Holdings has a price to earnings ratio of 10.02, based on the last twelve months. That is equivalent to an earnings yield of about 10.0%.
See our latest analysis for Macmahon Holdings
How Do I Calculate A Price To Earnings Ratio?
The formula for P/E is:
Price to Earnings Ratio = Share Price ÷ Earnings per Share (EPS)
Or for Macmahon Holdings:
P/E of 10.02 = A$0.22 ÷ A$0.022 (Based on the trailing twelve months to December 2018.)
Is A High Price-to-Earnings Ratio Good?
A higher P/E ratio means that investors are paying a higher price for each A$1 of company earnings. That is not a good or a bad thing per se, but a high P/E does imply buyers are optimistic about the future.
How Growth Rates Impact P/E Ratios
Probably the most important factor in determining what P/E a company trades on is the earnings growth. Earnings growth means that in the future the ‘E’ will be higher. That means even if the current P/E is high, it will reduce over time if the share price stays flat. Then, a lower P/E should attract more buyers, pushing the share price up.
It’s nice to see that Macmahon Holdings grew EPS by a stonking 347% in the last year. And it has bolstered its earnings per share by 27% per year over the last five years. With that performance, I would expect it to have an above average P/E ratio.
How Does Macmahon Holdings’s P/E Ratio Compare To Its Peers?
The P/E ratio essentially measures market expectations of a company. We can see in the image below that the average P/E (11.4) for companies in the metals and mining industry is higher than Macmahon Holdings’s P/E.
Its relatively low P/E ratio indicates that Macmahon Holdings shareholders think it will struggle to do as well as other companies in its industry classification. Since the market seems unimpressed with Macmahon Holdings, it’s quite possible it could surprise on the upside. You should delve deeper. I like to check if company insiders have been buying or selling.
A Limitation: P/E Ratios Ignore Debt and Cash In The Bank
It’s important to note that the P/E ratio considers the market capitalization, not the enterprise value. In other words, it does not consider any debt or cash that the company may have on the balance sheet. Hypothetically, a company could reduce its future P/E ratio by spending its cash (or taking on debt) to achieve higher earnings.
Spending on growth might be good or bad a few years later, but the point is that the P/E ratio does not account for the option (or lack thereof).
Macmahon Holdings’s Balance Sheet
Macmahon Holdings’s net debt is 17% of its market cap. That’s enough debt to impact the P/E ratio a little; so keep it in mind if you’re comparing it to companies without debt.
The Bottom Line On Macmahon Holdings’s P/E Ratio
Macmahon Holdings’s P/E is 10 which is below average (16.1) in the AU market. The company does have a little debt, and EPS growth was good last year. If the company can continue to grow earnings, then the current P/E may be unjustifiably low. Since analysts are predicting growth will continue, one might expect to see a higher P/E so it may be worth looking closer.
When the market is wrong about a stock, it gives savvy investors an opportunity. As value investor Benjamin Graham famously said, ‘In the short run, the market is a voting machine but in the long run, it is a weighing machine.’ So this free visualization of the analyst consensus on future earnings could help you make the right decision about whether to buy, sell, or hold.
You might be able to find a better buy than Macmahon Holdings. If you want a selection of possible winners, check out this free list of interesting companies that trade on a P/E below 20 (but have proven they can grow earnings).
We aim to bring you long-term focused research analysis driven by fundamental data. Note that our analysis may not factor in the latest price-sensitive company announcements or qualitative material.
If you spot an error that warrants correction, please contact the editor at editorial-team@simplywallst.com. This article by Simply Wall St is general in nature. It does not constitute a recommendation to buy or sell any stock, and does not take account of your objectives, or your financial situation. Simply Wall St has no position in the stocks mentioned. Thank you for reading.
