
 Yahoo Finance
 Is Knights Group Holdings plc's (LON:KGH) Latest Stock Performance A Reflection Of Its Financial Health?
Most readers would already be aware that Knights Group Holdings' (LON:KGH) stock increased significantly by 5.6% over the past week. Given the company's impressive performance, we decided to study its financial indicators more closely as a company's financial health over the long-term usually dictates market outcomes. In this article, we decided to focus on Knights Group Holdings' ROE.
Return on Equity or ROE is a test of how effectively a company is growing its value and managing investors’ money. Put another way, it reveals the company's success at turning shareholder investments into profits.
See our latest analysis for Knights Group Holdings
How To Calculate Return On Equity?
The formula for return on equity is:
Return on Equity = Net Profit (from continuing operations) ÷ Shareholders' Equity
So, based on the above formula, the ROE for Knights Group Holdings is:
10.0% = UK£9.6m ÷ UK£96m (Based on the trailing twelve months to October 2023).
The 'return' is the amount earned after tax over the last twelve months. So, this means that for every £1 of its shareholder's investments, the company generates a profit of £0.10.
What Has ROE Got To Do With Earnings Growth?
We have already established that ROE serves as an efficient profit-generating gauge for a company's future earnings. Depending on how much of these profits the company reinvests or "retains", and how effectively it does so, we are then able to assess a company’s earnings growth potential. Generally speaking, other things being equal, firms with a high return on equity and profit retention, have a higher growth rate than firms that don’t share these attributes.
Knights Group Holdings' Earnings Growth And 10.0% ROE
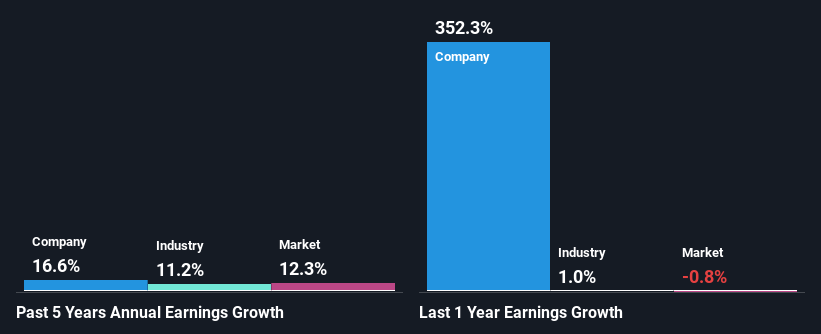
To begin with, Knights Group Holdings seems to have a respectable ROE. Even so, when compared with the average industry ROE of 14%, we aren't very excited. Knights Group Holdings was still able to see a decent net income growth of 17% over the past five years. So, there might be other aspects that are positively influencing earnings growth. For instance, the company has a low payout ratio or is being managed efficiently. However, not to forget, the company does have a decent ROE to begin with, just that it is lower than the industry average. So this also does lend some color to the fairly high earnings growth seen by the company.
We then compared Knights Group Holdings' net income growth with the industry and we're pleased to see that the company's growth figure is higher when compared with the industry which has a growth rate of 11% in the same 5-year period.
Earnings growth is an important metric to consider when valuing a stock. The investor should try to establish if the expected growth or decline in earnings, whichever the case may be, is priced in. By doing so, they will have an idea if the stock is headed into clear blue waters or if swampy waters await. Is Knights Group Holdings fairly valued compared to other companies? These 3 valuation measures might help you decide.
Is Knights Group Holdings Efficiently Re-investing Its Profits?
With a three-year median payout ratio of 37% (implying that the company retains 63% of its profits), it seems that Knights Group Holdings is reinvesting efficiently in a way that it sees respectable amount growth in its earnings and pays a dividend that's well covered.
Additionally, Knights Group Holdings has paid dividends over a period of five years which means that the company is pretty serious about sharing its profits with shareholders. Existing analyst estimates suggest that the company's future payout ratio is expected to drop to 20% over the next three years.
Conclusion
In total, we are pretty happy with Knights Group Holdings' performance. In particular, it's great to see that the company has seen significant growth in its earnings backed by a respectable ROE and a high reinvestment rate. With that said, the latest industry analyst forecasts reveal that the company's earnings are expected to accelerate. To know more about the latest analysts predictions for the company, check out this visualization of analyst forecasts for the company.
Have feedback on this article? Concerned about the content? Get in touch with us directly. Alternatively, email editorial-team (at) simplywallst.com.
This article by Simply Wall St is general in nature. We provide commentary based on historical data and analyst forecasts only using an unbiased methodology and our articles are not intended to be financial advice. It does not constitute a recommendation to buy or sell any stock, and does not take account of your objectives, or your financial situation. We aim to bring you long-term focused analysis driven by fundamental data. Note that our analysis may not factor in the latest price-sensitive company announcements or qualitative material. Simply Wall St has no position in any stocks mentioned.
