
 Yahoo Finance
 Kiwi Property Group Limited (NZSE:KPG) Is Up But Financials Look Inconsistent: Which Way Is The Stock Headed?
Most readers would already know that Kiwi Property Group's (NZSE:KPG) stock increased by 5.7% over the past three months. Given that the stock prices usually follow long-term business performance, we wonder if the company's mixed financials could have any adverse effect on its current price price movement In this article, we decided to focus on Kiwi Property Group's ROE.
Return on equity or ROE is an important factor to be considered by a shareholder because it tells them how effectively their capital is being reinvested. In simpler terms, it measures the profitability of a company in relation to shareholder's equity.
Check out our latest analysis for Kiwi Property Group
How To Calculate Return On Equity?
ROE can be calculated by using the formula:
Return on Equity = Net Profit (from continuing operations) ÷ Shareholders' Equity
So, based on the above formula, the ROE for Kiwi Property Group is:
9.2% = NZ$197m ÷ NZ$2.1b (Based on the trailing twelve months to March 2021).
The 'return' refers to a company's earnings over the last year. That means that for every NZ$1 worth of shareholders' equity, the company generated NZ$0.09 in profit.
Why Is ROE Important For Earnings Growth?
So far, we've learned that ROE is a measure of a company's profitability. Based on how much of its profits the company chooses to reinvest or "retain", we are then able to evaluate a company's future ability to generate profits. Assuming all else is equal, companies that have both a higher return on equity and higher profit retention are usually the ones that have a higher growth rate when compared to companies that don't have the same features.
Kiwi Property Group's Earnings Growth And 9.2% ROE
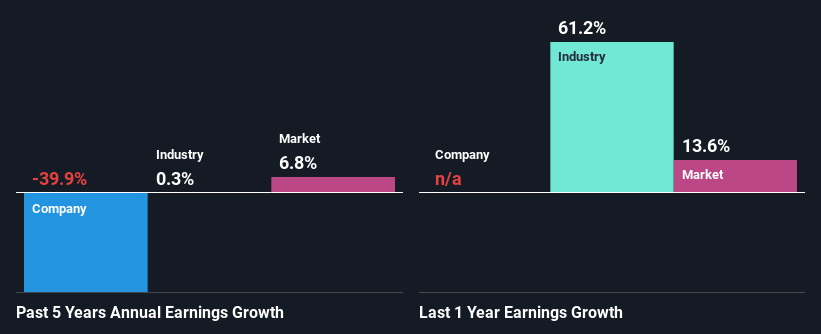
On the face of it, Kiwi Property Group's ROE is not much to talk about. However, its ROE is similar to the industry average of 10.0%, so we won't completely dismiss the company. But then again, Kiwi Property Group's five year net income shrunk at a rate of 40%. Remember, the company's ROE is a bit low to begin with. Hence, this goes some way in explaining the shrinking earnings.
That being said, we compared Kiwi Property Group's performance with the industry and were concerned when we found that while the company has shrunk its earnings, the industry has grown its earnings at a rate of 0.3% in the same period.
Earnings growth is an important metric to consider when valuing a stock. What investors need to determine next is if the expected earnings growth, or the lack of it, is already built into the share price. This then helps them determine if the stock is placed for a bright or bleak future. Has the market priced in the future outlook for KPG? You can find out in our latest intrinsic value infographic research report.
Is Kiwi Property Group Using Its Retained Earnings Effectively?
While the company did payout a portion of its dividend in the past, it currently doesn't pay a dividend. This implies that potentially all of its profits are being reinvested in the business.
Summary
Overall, we have mixed feelings about Kiwi Property Group. While the company does have a high rate of profit retention, its low rate of return is probably hampering its earnings growth. That being so, the latest industry analyst forecasts show that analysts are forecasting a slight improvement in the company's future earnings growth. The company's existing shareholders might have some respite after all. To know more about the latest analysts predictions for the company, check out this visualization of analyst forecasts for the company.
This article by Simply Wall St is general in nature. It does not constitute a recommendation to buy or sell any stock, and does not take account of your objectives, or your financial situation. We aim to bring you long-term focused analysis driven by fundamental data. Note that our analysis may not factor in the latest price-sensitive company announcements or qualitative material. Simply Wall St has no position in any stocks mentioned.
Have feedback on this article? Concerned about the content? Get in touch with us directly. Alternatively, email editorial-team (at) simplywallst.com.
