
 Yahoo Finance
 Kingsgate Consolidated (ASX:KCN) delivers shareholders enviable 38% CAGR over 5 years, surging 12% in the last week alone
Buying shares in the best businesses can build meaningful wealth for you and your family. And highest quality companies can see their share prices grow by huge amounts. Just think about the savvy investors who held Kingsgate Consolidated Limited (ASX:KCN) shares for the last five years, while they gained 406%. If that doesn't get you thinking about long term investing, we don't know what will. Better yet, the share price has risen 12% in the last week.
The past week has proven to be lucrative for Kingsgate Consolidated investors, so let's see if fundamentals drove the company's five-year performance.
See our latest analysis for Kingsgate Consolidated
In his essay The Superinvestors of Graham-and-Doddsville Warren Buffett described how share prices do not always rationally reflect the value of a business. One flawed but reasonable way to assess how sentiment around a company has changed is to compare the earnings per share (EPS) with the share price.
During the five years of share price growth, Kingsgate Consolidated moved from a loss to profitability. Sometimes, the start of profitability is a major inflection point that can signal fast earnings growth to come, which in turn justifies very strong share price gains.
The image below shows how EPS has tracked over time (if you click on the image you can see greater detail).
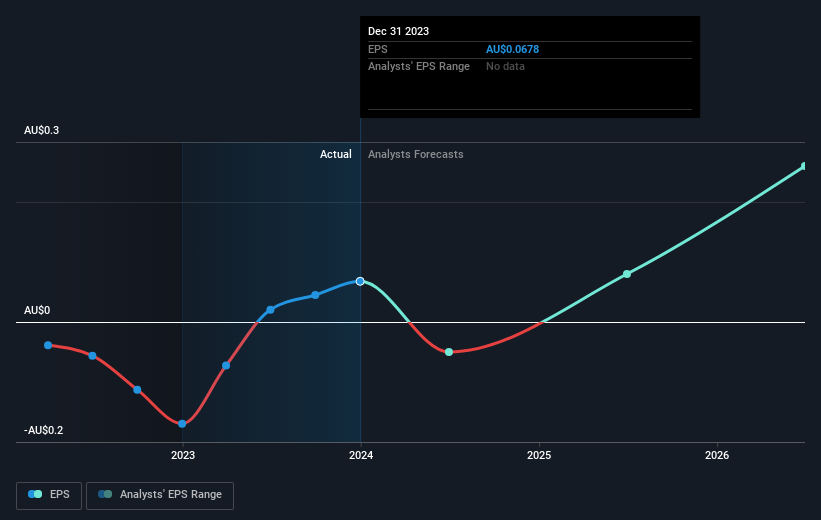
We know that Kingsgate Consolidated has improved its bottom line over the last three years, but what does the future have in store? Take a more thorough look at Kingsgate Consolidated's financial health with this free report on its balance sheet.
A Different Perspective
Investors in Kingsgate Consolidated had a tough year, with a total loss of 8.7%, against a market gain of about 13%. Even the share prices of good stocks drop sometimes, but we want to see improvements in the fundamental metrics of a business, before getting too interested. On the bright side, long term shareholders have made money, with a gain of 38% per year over half a decade. If the fundamental data continues to indicate long term sustainable growth, the current sell-off could be an opportunity worth considering. It's always interesting to track share price performance over the longer term. But to understand Kingsgate Consolidated better, we need to consider many other factors. Consider for instance, the ever-present spectre of investment risk. We've identified 2 warning signs with Kingsgate Consolidated (at least 1 which is significant) , and understanding them should be part of your investment process.
If you would prefer to check out another company -- one with potentially superior financials -- then do not miss this free list of companies that have proven they can grow earnings.
Please note, the market returns quoted in this article reflect the market weighted average returns of stocks that currently trade on Australian exchanges.
Have feedback on this article? Concerned about the content? Get in touch with us directly. Alternatively, email editorial-team (at) simplywallst.com.
This article by Simply Wall St is general in nature. We provide commentary based on historical data and analyst forecasts only using an unbiased methodology and our articles are not intended to be financial advice. It does not constitute a recommendation to buy or sell any stock, and does not take account of your objectives, or your financial situation. We aim to bring you long-term focused analysis driven by fundamental data. Note that our analysis may not factor in the latest price-sensitive company announcements or qualitative material. Simply Wall St has no position in any stocks mentioned.
