
 Yahoo Finance
 What Kind Of Investor Owns Most Of ING Groep N.V. (AMS:INGA)?

A look at the shareholders of ING Groep N.V. (AMS:INGA) can tell us which group is most powerful. Institutions often own shares in more established companies, while it’s not unusual to see insiders own a fair bit of smaller companies. Companies that used to be publicly owned tend to have lower insider ownership.
ING Groep has a market capitalization of €43b, so it’s too big to fly under the radar. We’d expect to see both institutions and retail investors owning a portion of the company. Taking a look at our data on the ownership groups (below), it’s seems that institutions own shares in the company. Let’s take a closer look to see what the different types of shareholder can tell us about INGA.
View our latest analysis for ING Groep
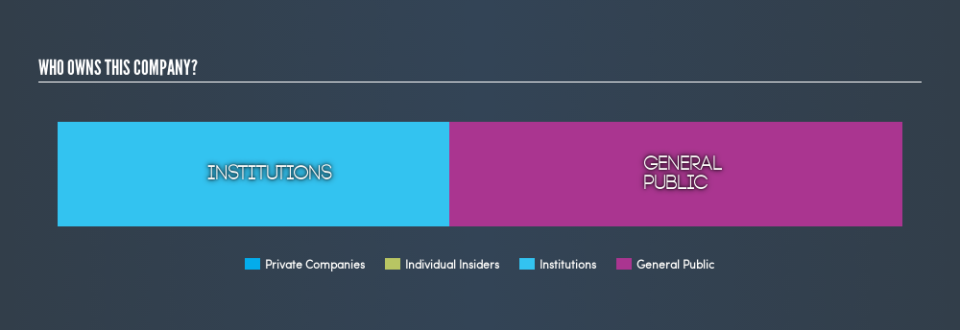
What Does The Institutional Ownership Tell Us About ING Groep?
Institutions typically measure themselves against a benchmark when reporting to their own investors, so they often become more enthusiastic about a stock once it’s included in a major index. We would expect most companies to have some institutions on the register, especially if they are growing.
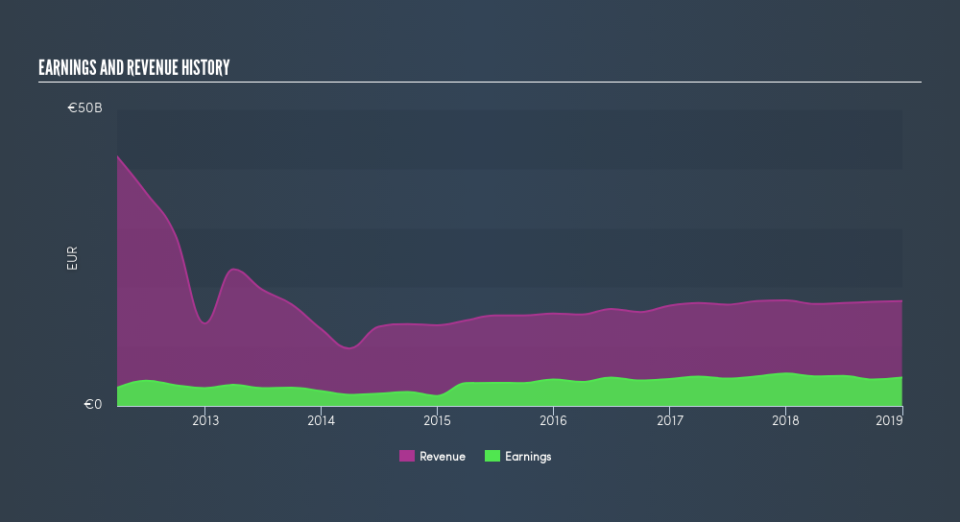
ING Groep already has institutions on the share registry. Indeed, they own 46% of the company. This implies the analysts working for those institutions have looked at the stock and they like it. But just like anyone else, they could be wrong. If multiple institutions change their view on a stock at the same time, you could see the share price drop fast. It’s therefore worth looking at ING Groep’s earnings history, below. Of course, the future is what really matters.
Hedge funds don’t have many shares in ING Groep. Quite a few analysts cover the stock, so you could look into forecast growth quite easily.
Insider Ownership Of ING Groep
While the precise definition of an insider can be subjective, almost everyone considers board members to be insiders. Company management run the business, but the CEO will answer to the board, even if he or she is a member of it.
Most consider insider ownership a positive because it can indicate the board is well aligned with other shareholders. However, on some occasions too much power is concentrated within this group.
Our information suggests that ING Groep N.V. insiders own under 1% of the company. Being so large, we would not expect insiders to own a large proportion of the stock. Collectively, they own €4.4m of stock. Arguably recent buying and selling is just as important to consider. You can click here to see if insiders have been buying or selling.
General Public Ownership
The general public, who are mostly retail investors, collectively hold 54% of ING Groep shares. This level of ownership gives retail investors the power to sway key policy decisions such as board composition, executive compensation, and the dividend payout ratio.
Next Steps:
I find it very interesting to look at who exactly owns a company. But to truly gain insight, we need to consider other information, too.
I always like to check for a history of revenue growth. You can too, by accessing this free chart of historic revenue and earnings in this detailed graph.
If you would prefer discover what analysts are predicting in terms of future growth, do not miss this free report on analyst forecasts.
NB: Figures in this article are calculated using data from the last twelve months, which refer to the 12-month period ending on the last date of the month the financial statement is dated. This may not be consistent with full year annual report figures.
We aim to bring you long-term focused research analysis driven by fundamental data. Note that our analysis may not factor in the latest price-sensitive company announcements or qualitative material.
If you spot an error that warrants correction, please contact the editor at editorial-team@simplywallst.com. This article by Simply Wall St is general in nature. It does not constitute a recommendation to buy or sell any stock, and does not take account of your objectives, or your financial situation. Simply Wall St has no position in the stocks mentioned. Thank you for reading.
