
 Yahoo Finance
 Kellanova (K) Stock Up on Former Kellogg's Q1 Earnings Beat
Kellanova K delivered first-quarter 2024 results for the company that formerly operated as Kellogg Company. The company’s top and the bottom line surpassed the Zacks Consensus Estimate in the quarter. The company’s quarterly earnings increased year over year while net sales fell from the year-ago quarter’s level.
Despite industry-wide volume softness and currency headwinds, the company managed to achieve organic net sales growth toward the upper end of its long-term target range. Management is on track with pricing actions to mitigate the adverse impact of input-cost inflation. The company reaffirmed its 2024 guidance. K’s shares were up 2.7% in the pre-market trading session on May 2.
Quarter in Detail
Kellanova reported adjusted earnings of $1.01 per share, increasing 29.5% year over year. On a currency-neutral basis, adjusted earnings per share (EPS) rose 33.3% to $1.04. The upside can be attributed to increased operating profits. The bottom line surpassed the Zacks Consensus Estimate of 85 cents.
The company recorded net sales of $3,200 million, surpassing the Zacks Consensus Estimate of $3,167.6 million. However, the top line fell 4.3% year over year. The downside can be attributed to unfavorable currency movements and divestiture of the company’s Russia business, which offset favorable price/mix. Organic net sales (excluding currency and divestiture impacts) increased 5%.
Kellanova Price, Consensus and EPS Surprise
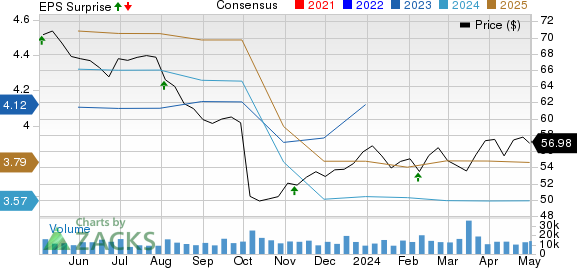
Kellanova price-consensus-eps-surprise-chart | Kellanova Quote
Kellanova’s adjusted operating profit increased 26% to $508 million while increasing 30% to $523 million on a currency-neutral basis.
Segment Discussion
Sales in the North America segment amounted to $1,688 million, up 0.1% year over year. Growth in price/mix, resulting from actions undertaken in the previous year to address high input cost inflation, was countered by a volume decline stemming from elasticities across various categories. Net sales also inched up 0.1% on an organic basis.
Revenues in the Europe segment totaled $599 million, down 0.7% year over year. Volume pressures stemming from elasticity across categories and the divestiture of operations in Russia last year contributed to the downside. However, this impact was partially mitigated by price/mix growth resulting from prior-year actions aimed at offsetting high input cost inflation. Organic net sales increased 2.6%.
Revenues in Latin America totaled $314 million, up 10.9% year over year, backed by favorable price/mix and foreign currency rates. Organic sales ascended 5.2%.
Revenues in the Asia Pacific and the Middle East & Africa segment totaled $600 million, down 22.1% year over year. Unfavorable foreign currency rates caused the downside. However, the favorable price/mix was a breather. Organic sales increased 19.4%.
Other Financials
The company ended the reported quarter with cash and cash equivalents of $242 million, long-term debt of $4,395 million and total equity of $3,278 million. Kellanova generated net cash from operating activities of $364 million for the year-to-date period ended Mar 30, 2024. Free cash flow was $209 million during this time.
2024 Guidance
Kellanova expects organic net sales growth of nearly 3% or more, driven by snacks brands and emerging markets. The guidance remains within its long-term target range. For 2024, the adjusted operating profit is expected to be $1,850-1,900 million. Finally, K envisions adjusted EPS to come in the band of $3.55-$3.65.
The Zacks Rank #3 (Hold) stock has increased 5.3% in the past three months compared with the industry’s growth of 6.3%.
3 Top Staple Picks
Vital Farms Inc. VITL offers a range of produced pasture-raised foods. It currently carries a Zacks Rank #2 (Buy). VITL has a trailing four-quarter average earnings surprise of 155.4%. You can see the complete list of today’s Zacks #1 (Strong Buy) Rank stocks here.
The Zacks Consensus Estimate for Vital Farms’ current financial-year sales and earnings suggests growth of 19.5% and 30.5%, respectively, from the year-ago reported numbers.
Utz Brands Inc. UTZ manufactures a diverse portfolio of salty snacks, currently carrying a Zacks Rank #2. UTZ has a trailing four-quarter earnings surprise of 2.6% on average.
The Zacks Consensus Estimate for Utz Brands’ current financial-year earnings suggests growth of 19.3% from the year-ago reported numbers.
Celsius Holdings CELH, which offers functional drinks and liquid supplements, currently carries a Zacks Rank #2. CELH has a trailing four-quarter earnings surprise of 67.4%, on average.
The Zacks Consensus Estimate for Celsius Holdings’ current financial-year sales and earnings suggests growth of 41.6% each from the year-ago reported figures.
Want the latest recommendations from Zacks Investment Research? Today, you can download 7 Best Stocks for the Next 30 Days. Click to get this free report
Kellanova (K) : Free Stock Analysis Report
Celsius Holdings Inc. (CELH) : Free Stock Analysis Report
Vital Farms, Inc. (VITL) : Free Stock Analysis Report
Utz Brands, Inc. (UTZ) : Free Stock Analysis Report
