
 Yahoo Finance
 Joyce (ASX:JYC) Is Very Good At Capital Allocation
If we want to find a potential multi-bagger, often there are underlying trends that can provide clues. Amongst other things, we'll want to see two things; firstly, a growing return on capital employed (ROCE) and secondly, an expansion in the company's amount of capital employed. Ultimately, this demonstrates that it's a business that is reinvesting profits at increasing rates of return. And in light of that, the trends we're seeing at Joyce's (ASX:JYC) look very promising so lets take a look.
What Is Return On Capital Employed (ROCE)?
If you haven't worked with ROCE before, it measures the 'return' (pre-tax profit) a company generates from capital employed in its business. To calculate this metric for Joyce, this is the formula:
Return on Capital Employed = Earnings Before Interest and Tax (EBIT) ÷ (Total Assets - Current Liabilities)
0.47 = AU$24m ÷ (AU$86m - AU$34m) (Based on the trailing twelve months to June 2023).
Therefore, Joyce has an ROCE of 47%. In absolute terms that's a great return and it's even better than the Specialty Retail industry average of 19%.
View our latest analysis for Joyce
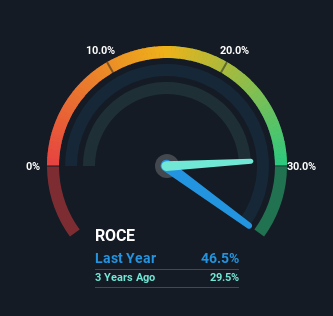
Historical performance is a great place to start when researching a stock so above you can see the gauge for Joyce's ROCE against it's prior returns. If you're interested in investigating Joyce's past further, check out this free graph of past earnings, revenue and cash flow.
What Does the ROCE Trend For Joyce Tell Us?
Investors would be pleased with what's happening at Joyce. Over the last five years, returns on capital employed have risen substantially to 47%. The amount of capital employed has increased too, by 31%. This can indicate that there's plenty of opportunities to invest capital internally and at ever higher rates, a combination that's common among multi-baggers.
On a side note, we noticed that the improvement in ROCE appears to be partly fueled by an increase in current liabilities. The current liabilities has increased to 40% of total assets, so the business is now more funded by the likes of its suppliers or short-term creditors. Keep an eye out for future increases because when the ratio of current liabilities to total assets gets particularly high, this can introduce some new risks for the business.
What We Can Learn From Joyce's ROCE
To sum it up, Joyce has proven it can reinvest in the business and generate higher returns on that capital employed, which is terrific. And with the stock having performed exceptionally well over the last five years, these patterns are being accounted for by investors. With that being said, we still think the promising fundamentals mean the company deserves some further due diligence.
One more thing, we've spotted 2 warning signs facing Joyce that you might find interesting.
If you want to search for more stocks that have been earning high returns, check out this free list of stocks with solid balance sheets that are also earning high returns on equity.
Have feedback on this article? Concerned about the content? Get in touch with us directly. Alternatively, email editorial-team (at) simplywallst.com.
This article by Simply Wall St is general in nature. We provide commentary based on historical data and analyst forecasts only using an unbiased methodology and our articles are not intended to be financial advice. It does not constitute a recommendation to buy or sell any stock, and does not take account of your objectives, or your financial situation. We aim to bring you long-term focused analysis driven by fundamental data. Note that our analysis may not factor in the latest price-sensitive company announcements or qualitative material. Simply Wall St has no position in any stocks mentioned.
