
 Yahoo Finance
 Jefferies Financial Group (NYSE:JEF) shareholders YoY returns are lagging the company's 25% three-year earnings growth
While Jefferies Financial Group Inc. (NYSE:JEF) shareholders are probably generally happy, the stock hasn't had particularly good run recently, with the share price falling 13% in the last quarter. In contrast the stock has done reasonably well over three years. In that time the stock gained 49%, besting the market return of 44%.
Since the long term performance has been good but there's been a recent pullback of 4.1%, let's check if the fundamentals match the share price.
Check out our latest analysis for Jefferies Financial Group
There is no denying that markets are sometimes efficient, but prices do not always reflect underlying business performance. One way to examine how market sentiment has changed over time is to look at the interaction between a company's share price and its earnings per share (EPS).
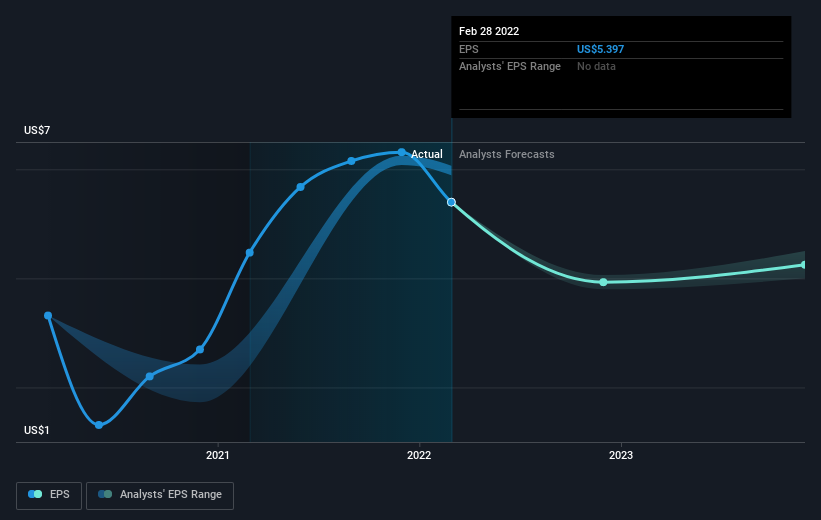
Jefferies Financial Group was able to grow its EPS at 98% per year over three years, sending the share price higher. The average annual share price increase of 14% is actually lower than the EPS growth. Therefore, it seems the market has moderated its expectations for growth, somewhat. This cautious sentiment is reflected in its (fairly low) P/E ratio of 5.22.
You can see below how EPS has changed over time (discover the exact values by clicking on the image).
It's good to see that there was some significant insider buying in the last three months. That's a positive. That said, we think earnings and revenue growth trends are even more important factors to consider. Dive deeper into the earnings by checking this interactive graph of Jefferies Financial Group's earnings, revenue and cash flow.
What About Dividends?
As well as measuring the share price return, investors should also consider the total shareholder return (TSR). The TSR incorporates the value of any spin-offs or discounted capital raisings, along with any dividends, based on the assumption that the dividends are reinvested. So for companies that pay a generous dividend, the TSR is often a lot higher than the share price return. We note that for Jefferies Financial Group the TSR over the last 3 years was 74%, which is better than the share price return mentioned above. And there's no prize for guessing that the dividend payments largely explain the divergence!
A Different Perspective
While it's never nice to take a loss, Jefferies Financial Group shareholders can take comfort that , including dividends,their trailing twelve month loss of 2.8% wasn't as bad as the market loss of around 7.6%. Longer term investors wouldn't be so upset, since they would have made 8%, each year, over five years. In the best case scenario the last year is just a temporary blip on the journey to a brighter future. While it is well worth considering the different impacts that market conditions can have on the share price, there are other factors that are even more important. Case in point: We've spotted 2 warning signs for Jefferies Financial Group you should be aware of, and 1 of them makes us a bit uncomfortable.
Jefferies Financial Group is not the only stock that insiders are buying. For those who like to find winning investments this free list of growing companies with recent insider purchasing, could be just the ticket.
Please note, the market returns quoted in this article reflect the market weighted average returns of stocks that currently trade on US exchanges.
Have feedback on this article? Concerned about the content? Get in touch with us directly. Alternatively, email editorial-team (at) simplywallst.com.
This article by Simply Wall St is general in nature. We provide commentary based on historical data and analyst forecasts only using an unbiased methodology and our articles are not intended to be financial advice. It does not constitute a recommendation to buy or sell any stock, and does not take account of your objectives, or your financial situation. We aim to bring you long-term focused analysis driven by fundamental data. Note that our analysis may not factor in the latest price-sensitive company announcements or qualitative material. Simply Wall St has no position in any stocks mentioned.
