
 Yahoo Finance
 JD Sports Fashion (LON:JD.) investors are sitting on a loss of 35% if they invested three years ago
Many investors define successful investing as beating the market average over the long term. But its virtually certain that sometimes you will buy stocks that fall short of the market average returns. We regret to report that long term JD Sports Fashion Plc (LON:JD.) shareholders have had that experience, with the share price dropping 36% in three years, versus a market decline of about 14%. The more recent news is of little comfort, with the share price down 29% in a year.
It's worthwhile assessing if the company's economics have been moving in lockstep with these underwhelming shareholder returns, or if there is some disparity between the two. So let's do just that.
See our latest analysis for JD Sports Fashion
While the efficient markets hypothesis continues to be taught by some, it has been proven that markets are over-reactive dynamic systems, and investors are not always rational. By comparing earnings per share (EPS) and share price changes over time, we can get a feel for how investor attitudes to a company have morphed over time.
During the three years that the share price fell, JD Sports Fashion's earnings per share (EPS) dropped by 0.7% each year. This reduction in EPS is slower than the 14% annual reduction in the share price. So it seems the market was too confident about the business, in the past.
The image below shows how EPS has tracked over time (if you click on the image you can see greater detail).
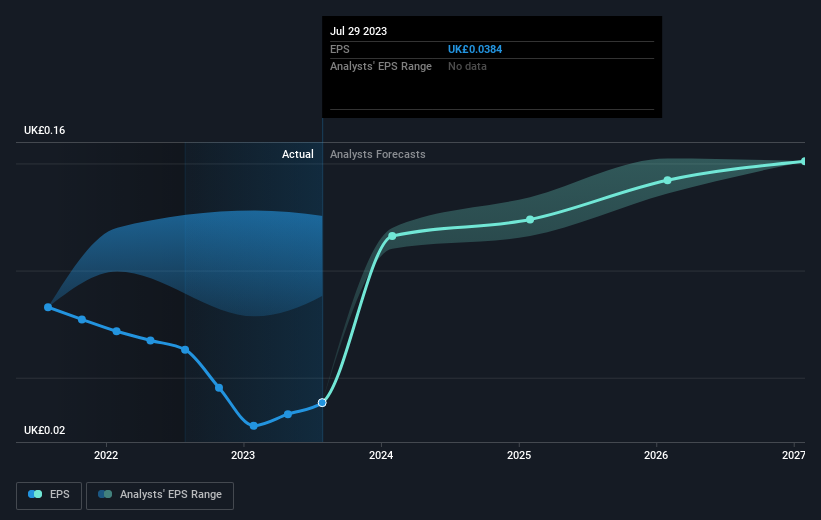
We consider it positive that insiders have made significant purchases in the last year. Even so, future earnings will be far more important to whether current shareholders make money. It might be well worthwhile taking a look at our free report on JD Sports Fashion's earnings, revenue and cash flow.
A Different Perspective
JD Sports Fashion shareholders are down 29% for the year (even including dividends), but the market itself is up 2.4%. Even the share prices of good stocks drop sometimes, but we want to see improvements in the fundamental metrics of a business, before getting too interested. Regrettably, last year's performance caps off a bad run, with the shareholders facing a total loss of 0.6% per year over five years. We realise that Baron Rothschild has said investors should "buy when there is blood on the streets", but we caution that investors should first be sure they are buying a high quality business. It's always interesting to track share price performance over the longer term. But to understand JD Sports Fashion better, we need to consider many other factors. Even so, be aware that JD Sports Fashion is showing 2 warning signs in our investment analysis , you should know about...
JD Sports Fashion is not the only stock insiders are buying. So take a peek at this free list of growing companies with insider buying.
Please note, the market returns quoted in this article reflect the market weighted average returns of stocks that currently trade on British exchanges.
Have feedback on this article? Concerned about the content? Get in touch with us directly. Alternatively, email editorial-team (at) simplywallst.com.
This article by Simply Wall St is general in nature. We provide commentary based on historical data and analyst forecasts only using an unbiased methodology and our articles are not intended to be financial advice. It does not constitute a recommendation to buy or sell any stock, and does not take account of your objectives, or your financial situation. We aim to bring you long-term focused analysis driven by fundamental data. Note that our analysis may not factor in the latest price-sensitive company announcements or qualitative material. Simply Wall St has no position in any stocks mentioned.
