
 Yahoo Finance
 Is JD.com, Inc.'s (NASDAQ:JD) Latest Stock Performance Being Led By Its Strong Fundamentals?
Most readers would already know that JD.com's (NASDAQ:JD) stock increased by 3.6% over the past month. Given its impressive performance, we decided to study the company's key financial indicators as a company's long-term fundamentals usually dictate market outcomes. Specifically, we decided to study JD.com's ROE in this article.
Return on equity or ROE is an important factor to be considered by a shareholder because it tells them how effectively their capital is being reinvested. In short, ROE shows the profit each dollar generates with respect to its shareholder investments.
See our latest analysis for JD.com
How Do You Calculate Return On Equity?
The formula for ROE is:
Return on Equity = Net Profit (from continuing operations) ÷ Shareholders' Equity
So, based on the above formula, the ROE for JD.com is:
23% = CN¥52b ÷ CN¥226b (Based on the trailing twelve months to March 2021).
The 'return' is the amount earned after tax over the last twelve months. So, this means that for every $1 of its shareholder's investments, the company generates a profit of $0.23.
What Has ROE Got To Do With Earnings Growth?
Thus far, we have learned that ROE measures how efficiently a company is generating its profits. Based on how much of its profits the company chooses to reinvest or "retain", we are then able to evaluate a company's future ability to generate profits. Assuming all else is equal, companies that have both a higher return on equity and higher profit retention are usually the ones that have a higher growth rate when compared to companies that don't have the same features.
A Side By Side comparison of JD.com's Earnings Growth And 23% ROE
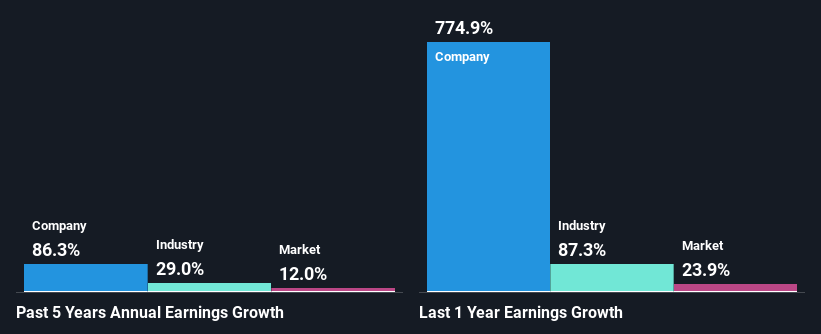
First thing first, we like that JD.com has an impressive ROE. Further, even comparing with the industry average if 21%, the company's ROE is quite respectable. Therefore, it might not be wrong to say that the impressive five year 86% net income growth seen by JD.com was probably achieved as a result of the high ROE.
As a next step, we compared JD.com's net income growth with the industry, and pleasingly, we found that the growth seen by the company is higher than the average industry growth of 29%.
Earnings growth is an important metric to consider when valuing a stock. It’s important for an investor to know whether the market has priced in the company's expected earnings growth (or decline). This then helps them determine if the stock is placed for a bright or bleak future. Is JD fairly valued? This infographic on the company's intrinsic value has everything you need to know.
Is JD.com Efficiently Re-investing Its Profits?
Conclusion
In total, we are pretty happy with JD.com's performance. In particular, it's great to see that the company is investing heavily into its business and along with a high rate of return, that has resulted in a sizeable growth in its earnings. Having said that, the company's earnings growth is expected to slow down, as forecasted in the current analyst estimates. To know more about the latest analysts predictions for the company, check out this visualization of analyst forecasts for the company.
This article by Simply Wall St is general in nature. It does not constitute a recommendation to buy or sell any stock, and does not take account of your objectives, or your financial situation. We aim to bring you long-term focused analysis driven by fundamental data. Note that our analysis may not factor in the latest price-sensitive company announcements or qualitative material. Simply Wall St has no position in any stocks mentioned.
Have feedback on this article? Concerned about the content? Get in touch with us directly. Alternatively, email editorial-team (at) simplywallst.com.
