
 Yahoo Finance
 JD.com, Inc. (NASDAQ:JD) Appears to Be Attractively Valued, but Falling Earnings May Continue to Weigh on Sentiment
This article originally appeared on Simply Wall St News.
Shares in JD.com, Inc. ( NASDAQ:JD ) have fallen this week along with most US listed Chinese stocks, and specifically those in the technology and education sectors. The sell-off follows a series of regulatory changes that have been imposed on several companies. There are wide ranging opinions on what China's government is trying to do, but the common theme appears to be increased control of technology driven companies. On Thursday China's securities regulator attempted to allay investor's fears following a call with a group of investors.
Some analysts believe there will be more regulatory changes to come, while others believe the sell-off is a buying opportunity. Which brings us to JD.com. The stock price has actually held up quite well when compared to similar companies. Nevertheless, it has fallen as much as 38% since February which may present an opportunity for investors if the outlook is positive and the valuation is attractive. The first step in assessing the potential opportunity is to to estimate the fair value for JD.com shares.
How Much is JD.com Worth?
We can estimate the intrinsic value of a company by taking the expected future cash flows and discounting them to their present value. This will be done using the Discounted Cash Flow (DCF) model. There's really not all that much to it, even though it might appear quite complex.
We would caution that there are many ways of valuing a company and, like the DCF, each technique has advantages and disadvantages in certain scenarios. For those who are keen learners of equity analysis, the Simply Wall St analysis model here may be something of interest to you.
View our latest analysis for JD.com
The method
We are going to use a two-stage DCF model, which, as the name states, takes into account two stages of growth. The first stage is generally a higher growth period which levels off heading towards the terminal value, captured in the second 'steady growth' period.To start off with, we need to estimate the next ten years of cash flows. Where possible we use analyst estimates, but when these aren't available we extrapolate the previous free cash flow (FCF) from the last estimate or reported value. We assume companies with shrinking free cash flow will slow their rate of shrinkage, and that companies with growing free cash flow will see their growth rate slow, over this period. We do this to reflect that growth tends to slow more in the early years than it does in later years.
Generally we assume that a dollar today is more valuable than a dollar in the future,so we discount the value of these future cash flows to their estimated value in today's dollars:
10-year free cash flow (FCF) estimate
2022 | 2023 | 2024 | 2025 | 2026 | 2027 | 2028 | 2029 | 2030 | 2031 | |
Levered FCF (CN¥, Millions) | CN¥25.1b | CN¥39.0b | CN¥47.2b | CN¥54.6b | CN¥60.1b | CN¥64.6b | CN¥68.5b | CN¥71.7b | CN¥74.5b | CN¥77.0b |
Growth Rate Estimate Source | Analyst x10 | Analyst x10 | Analyst x3 | Analyst x2 | Est @ 9.99% | Est @ 7.59% | Est @ 5.91% | Est @ 4.73% | Est @ 3.91% | Est @ 3.33% |
Present Value (CN¥, Millions) Discounted @ 7.7% | CN¥23.3k | CN¥33.6k | CN¥37.8k | CN¥40.6k | CN¥41.5k | CN¥41.4k | CN¥40.7k | CN¥39.6k | CN¥38.2k | CN¥36.7k |
("Est" = FCF growth rate estimated by Simply Wall St)
Present Value of 10-year Cash Flow (PVCF) = CN¥374b
The second stage is also known as Terminal Value, this is the business's cash flow after the first stage.For a number of reasons a very conservative growth rate is used that cannot exceed that of a country's GDP growth. In this case we have used the 5-year average of the 10-year government bond yield (2.0%) to estimate future growth. In the same way as with the 10-year 'growth' period, we discount future cash flows to today's value, using a cost of equity of 7.7%.
Terminal Value (TV) = FCF 2031 × (1 + g) ÷ (r g) = CN¥77b× (1 + 2.0%) ÷ (7.7% 2.0%) = CN¥1.4t
Present Value of Terminal Value (PVTV) = TV / (1 + r) 10 = CN¥1.4t÷ ( 1 + 7.7%) 10 = CN¥656b
The total value is the sum of cash flows for the next ten years plus the discounted terminal value, which results in the Total Equity Value,which in this case is CN¥1.0t. The last step is to then divide the equity value by the number of shares outstanding.Compared to the current share price of US$70.3, the company appears quite undervaluedat a 31% discount to where the stock price trades currently. Remember though, that this is just an approximate valuation, and like any complex formula - garbage in, garbage out.

Important assumptions
We would point out that the most important inputs to a discounted cash flow are the discount rate and of course the actual cash flows.You don't have to agree with these inputs and we recommend redoing the calculations yourself and experimenting with different inputs.
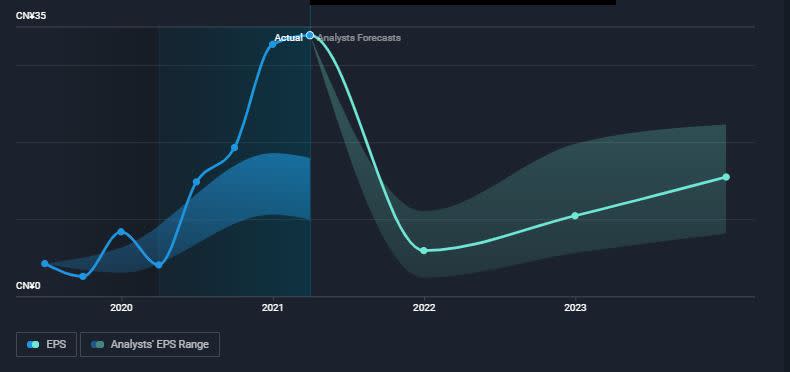
The above exercise suggests that the stock price is 31% below the intrinsic value. But, when we take a closer look at the earnings estimates for the next 18 months, we can see that earnings are expected to fall as much as 80% by the end of this year. Revenue is expected to rise steadily, but earnings are expected to dip in the short term due to rising costs.
The DCF calculation outlined above does include the dip in earnings over the next year, so the intrinsic value estimate doesn't change. But the prospect of falling earnings and the potential for more regulatory changes may weigh on sentiment. This means there could be a better opportunity to invest later in the year or next year.
The current share price certainly offers a better 'margin of safety' than it did when it was closer to $100, but it's a good idea to consider other factors that may affect the stock price in the immediate future.
Moving On:
Although the valuation of a company is important, itideally won't be the sole piece of analysis you scrutinize for a company.DCF models are not the be-all and end-all of investment valuation.Instead the best use for a DCF model is to test certain assumptions and theories to see if they would lead to the company being undervalued or overvalued.If a company grows at a different rate, or if its cost of equity or risk free rate changes sharply, the output can look very different.Why is the intrinsic value higher than the current share price?For JD.com, we've put together threefundamentalfactorsyou should further research:
Risks : We feel that you should assess the 1 warning sign for JD.com we've flagged before making an investment in the company.
Future Earnings : How does JD's growth rate compare to its peers and the wider market? Dig deeper into the analyst consensus number for the upcoming years by interacting with our free analyst growth expectation chart .
Other High Quality Alternatives : Do you like a good all-rounder? Explore our interactive list of high quality stocks to get an idea of what else is out there you may be missing!
PS. The Simply Wall St app conducts a discounted cash flow valuation for every stock on the NASDAQGS every day. If you want to find the calculation for other stocks just search here .
Simply Wall St analyst Richard Bowman and Simply Wall St have no position in any of the companies mentioned. This article is general in nature. It does not constitute a recommendation to buy or sell any stock and does not take account of your objectives, or your financial situation. We aim to bring you long-term focused analysis driven by fundamental data. Note that our analysis may not factor in the latest price-sensitive company announcements or qualitative material.
Have feedback on this article? Concerned about the content? Get in touch with us directly. Alternatively, email editorial-team@simplywallst.com
