
 Yahoo Finance
 iQIYI (NASDAQ:IQ) Is Looking To Continue Growing Its Returns On Capital
Finding a business that has the potential to grow substantially is not easy, but it is possible if we look at a few key financial metrics. Firstly, we'll want to see a proven return on capital employed (ROCE) that is increasing, and secondly, an expanding base of capital employed. If you see this, it typically means it's a company with a great business model and plenty of profitable reinvestment opportunities. With that in mind, we've noticed some promising trends at iQIYI (NASDAQ:IQ) so let's look a bit deeper.
Return On Capital Employed (ROCE): What Is It?
Just to clarify if you're unsure, ROCE is a metric for evaluating how much pre-tax income (in percentage terms) a company earns on the capital invested in its business. The formula for this calculation on iQIYI is:
Return on Capital Employed = Earnings Before Interest and Tax (EBIT) ÷ (Total Assets - Current Liabilities)
0.15 = CN¥3.2b ÷ (CN¥45b - CN¥22b) (Based on the trailing twelve months to December 2023).
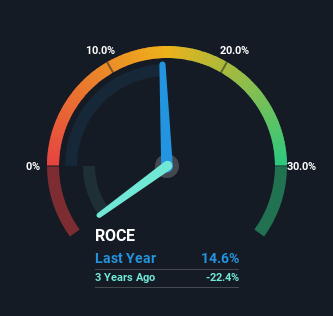
Thus, iQIYI has an ROCE of 15%. In absolute terms, that's a satisfactory return, but compared to the Entertainment industry average of 11% it's much better.
See our latest analysis for iQIYI
Above you can see how the current ROCE for iQIYI compares to its prior returns on capital, but there's only so much you can tell from the past. If you're interested, you can view the analysts predictions in our free analyst report for iQIYI .
So How Is iQIYI's ROCE Trending?
We're delighted to see that iQIYI is reaping rewards from its investments and has now broken into profitability. While the business was unprofitable in the past, it's now turned things around and is earning 15% on its capital. While returns have increased, the amount of capital employed by iQIYI has remained flat over the period. That being said, while an increase in efficiency is no doubt appealing, it'd be helpful to know if the company does have any investment plans going forward. Because in the end, a business can only get so efficient.
On a separate but related note, it's important to know that iQIYI has a current liabilities to total assets ratio of 50%, which we'd consider pretty high. This effectively means that suppliers (or short-term creditors) are funding a large portion of the business, so just be aware that this can introduce some elements of risk. Ideally we'd like to see this reduce as that would mean fewer obligations bearing risks.
The Bottom Line
To sum it up, iQIYI is collecting higher returns from the same amount of capital, and that's impressive. And since the stock has dived 81% over the last five years, there may be other factors affecting the company's prospects. Regardless, we think the underlying fundamentals warrant this stock for further investigation.
If you'd like to know about the risks facing iQIYI, we've discovered 1 warning sign that you should be aware of.
While iQIYI isn't earning the highest return, check out this free list of companies that are earning high returns on equity with solid balance sheets.
Have feedback on this article? Concerned about the content? Get in touch with us directly. Alternatively, email editorial-team (at) simplywallst.com.
This article by Simply Wall St is general in nature. We provide commentary based on historical data and analyst forecasts only using an unbiased methodology and our articles are not intended to be financial advice. It does not constitute a recommendation to buy or sell any stock, and does not take account of your objectives, or your financial situation. We aim to bring you long-term focused analysis driven by fundamental data. Note that our analysis may not factor in the latest price-sensitive company announcements or qualitative material. Simply Wall St has no position in any stocks mentioned.
