
 Yahoo Finance
 Investors in Westgold Resources (ASX:WGX) have unfortunately lost 63% over the last three years
If you are building a properly diversified stock portfolio, the chances are some of your picks will perform badly. Long term Westgold Resources Limited (ASX:WGX) shareholders know that all too well, since the share price is down considerably over three years. So they might be feeling emotional about the 65% share price collapse, in that time. The more recent news is of little comfort, with the share price down 50% in a year. Even worse, it's down 31% in about a month, which isn't fun at all. This could be related to the recent financial results - you can catch up on the most recent data by reading our company report.
Now let's have a look at the company's fundamentals, and see if the long term shareholder return has matched the performance of the underlying business.
See our latest analysis for Westgold Resources
To paraphrase Benjamin Graham: Over the short term the market is a voting machine, but over the long term it's a weighing machine. One imperfect but simple way to consider how the market perception of a company has shifted is to compare the change in the earnings per share (EPS) with the share price movement.
Over the three years that the share price declined, Westgold Resources' earnings per share (EPS) dropped significantly, falling to a loss. Due to the loss, it's not easy to use EPS as a reliable guide to the business. However, we can say we'd expect to see a falling share price in this scenario.
You can see below how EPS has changed over time (discover the exact values by clicking on the image).
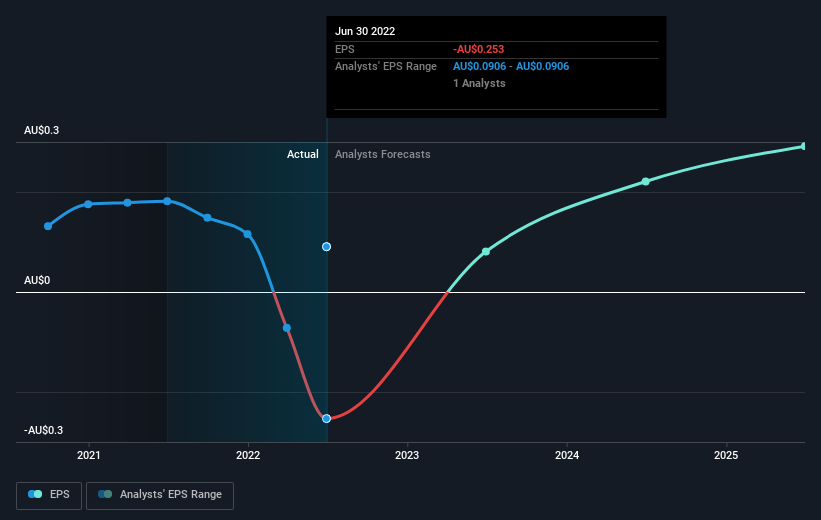
It might be well worthwhile taking a look at our free report on Westgold Resources' earnings, revenue and cash flow.
A Different Perspective
We regret to report that Westgold Resources shareholders are down 50% for the year (even including dividends). Unfortunately, that's worse than the broader market decline of 2.2%. However, it could simply be that the share price has been impacted by broader market jitters. It might be worth keeping an eye on the fundamentals, in case there's a good opportunity. Regrettably, last year's performance caps off a bad run, with the shareholders facing a total loss of 9% per year over five years. Generally speaking long term share price weakness can be a bad sign, though contrarian investors might want to research the stock in hope of a turnaround. I find it very interesting to look at share price over the long term as a proxy for business performance. But to truly gain insight, we need to consider other information, too. For example, we've discovered 1 warning sign for Westgold Resources that you should be aware of before investing here.
If you are like me, then you will not want to miss this free list of growing companies that insiders are buying.
Please note, the market returns quoted in this article reflect the market weighted average returns of stocks that currently trade on AU exchanges.
Have feedback on this article? Concerned about the content? Get in touch with us directly. Alternatively, email editorial-team (at) simplywallst.com.
This article by Simply Wall St is general in nature. We provide commentary based on historical data and analyst forecasts only using an unbiased methodology and our articles are not intended to be financial advice. It does not constitute a recommendation to buy or sell any stock, and does not take account of your objectives, or your financial situation. We aim to bring you long-term focused analysis driven by fundamental data. Note that our analysis may not factor in the latest price-sensitive company announcements or qualitative material. Simply Wall St has no position in any stocks mentioned.
Join A Paid User Research Session
You’ll receive a US$30 Amazon Gift card for 1 hour of your time while helping us build better investing tools for the individual investors like yourself. Sign up here
