
 Yahoo Finance
 Investors Will Want Boart Longyear Group's (ASX:BLY) Growth In ROCE To Persist
If we want to find a stock that could multiply over the long term, what are the underlying trends we should look for? One common approach is to try and find a company with returns on capital employed (ROCE) that are increasing, in conjunction with a growing amount of capital employed. This shows us that it's a compounding machine, able to continually reinvest its earnings back into the business and generate higher returns. Speaking of which, we noticed some great changes in Boart Longyear Group's (ASX:BLY) returns on capital, so let's have a look.
Understanding Return On Capital Employed (ROCE)
If you haven't worked with ROCE before, it measures the 'return' (pre-tax profit) a company generates from capital employed in its business. The formula for this calculation on Boart Longyear Group is:
Return on Capital Employed = Earnings Before Interest and Tax (EBIT) ÷ (Total Assets - Current Liabilities)
0.13 = US$76m ÷ (US$775m - US$195m) (Based on the trailing twelve months to June 2022).
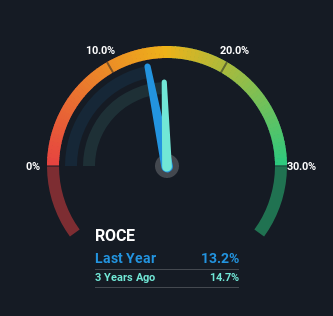
So, Boart Longyear Group has an ROCE of 13%. On its own, that's a standard return, however it's much better than the 10% generated by the Metals and Mining industry.
View our latest analysis for Boart Longyear Group
While the past is not representative of the future, it can be helpful to know how a company has performed historically, which is why we have this chart above. If you're interested in investigating Boart Longyear Group's past further, check out this free graph of past earnings, revenue and cash flow.
The Trend Of ROCE
Boart Longyear Group has recently broken into profitability so their prior investments seem to be paying off. The company was generating losses five years ago, but now it's earning 13% which is a sight for sore eyes. And unsurprisingly, like most companies trying to break into the black, Boart Longyear Group is utilizing 42% more capital than it was five years ago. This can indicate that there's plenty of opportunities to invest capital internally and at ever higher rates, both common traits of a multi-bagger.
One more thing to note, Boart Longyear Group has decreased current liabilities to 25% of total assets over this period, which effectively reduces the amount of funding from suppliers or short-term creditors. So shareholders would be pleased that the growth in returns has mostly come from underlying business performance.
The Bottom Line On Boart Longyear Group's ROCE
Overall, Boart Longyear Group gets a big tick from us thanks in most part to the fact that it is now profitable and is reinvesting in its business. And since the stock has dived 97% over the last five years, there may be other factors affecting the company's prospects. Regardless, we think the underlying fundamentals warrant this stock for further investigation.
If you'd like to know about the risks facing Boart Longyear Group, we've discovered 1 warning sign that you should be aware of.
While Boart Longyear Group isn't earning the highest return, check out this free list of companies that are earning high returns on equity with solid balance sheets.
Have feedback on this article? Concerned about the content? Get in touch with us directly. Alternatively, email editorial-team (at) simplywallst.com.
This article by Simply Wall St is general in nature. We provide commentary based on historical data and analyst forecasts only using an unbiased methodology and our articles are not intended to be financial advice. It does not constitute a recommendation to buy or sell any stock, and does not take account of your objectives, or your financial situation. We aim to bring you long-term focused analysis driven by fundamental data. Note that our analysis may not factor in the latest price-sensitive company announcements or qualitative material. Simply Wall St has no position in any stocks mentioned.
Join A Paid User Research Session
You’ll receive a US$30 Amazon Gift card for 1 hour of your time while helping us build better investing tools for the individual investors like yourself. Sign up here
