
 Yahoo Finance
 Investors in Trinity Exploration & Production (LON:TRIN) from a year ago are still down 34%, even after 24% gain this past week
Trinity Exploration & Production plc (LON:TRIN) shareholders should be happy to see the share price up 24% in the last week. But in truth the last year hasn't been good for the share price. After all, the share price is down 34% in the last year, significantly under-performing the market.
While the last year has been tough for Trinity Exploration & Production shareholders, this past week has shown signs of promise. So let's look at the longer term fundamentals and see if they've been the driver of the negative returns.
See our latest analysis for Trinity Exploration & Production
While the efficient markets hypothesis continues to be taught by some, it has been proven that markets are over-reactive dynamic systems, and investors are not always rational. One way to examine how market sentiment has changed over time is to look at the interaction between a company's share price and its earnings per share (EPS).
Trinity Exploration & Production managed to increase earnings per share from a loss to a profit, over the last 12 months.
Earnings per share growth rates aren't particularly useful for comparing with the share price, when a company has moved from loss to profit. But we may find different metrics more enlightening.
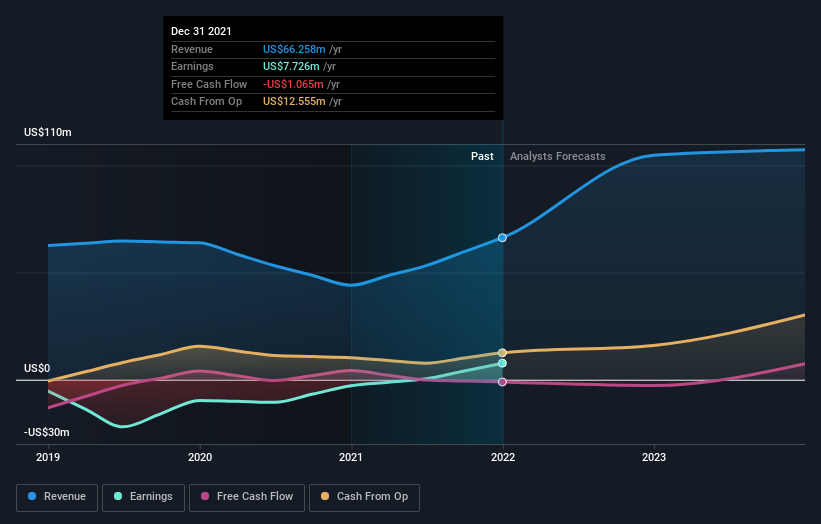
Trinity Exploration & Production managed to grow revenue over the last year, which is usually a real positive. Since we can't easily explain the share price movement based on these metrics, it might be worth considering how market sentiment has changed towards the stock.
You can see how earnings and revenue have changed over time in the image below (click on the chart to see the exact values).
We know that Trinity Exploration & Production has improved its bottom line over the last three years, but what does the future have in store? It might be well worthwhile taking a look at our free report on how its financial position has changed over time.
A Different Perspective
We regret to report that Trinity Exploration & Production shareholders are down 34% for the year. Unfortunately, that's worse than the broader market decline of 4.7%. However, it could simply be that the share price has been impacted by broader market jitters. It might be worth keeping an eye on the fundamentals, in case there's a good opportunity. Regrettably, last year's performance caps off a bad run, with the shareholders facing a total loss of 1.4% per year over five years. Generally speaking long term share price weakness can be a bad sign, though contrarian investors might want to research the stock in hope of a turnaround. While it is well worth considering the different impacts that market conditions can have on the share price, there are other factors that are even more important. Take risks, for example - Trinity Exploration & Production has 2 warning signs (and 1 which is a bit concerning) we think you should know about.
Of course, you might find a fantastic investment by looking elsewhere. So take a peek at this free list of companies we expect will grow earnings.
Please note, the market returns quoted in this article reflect the market weighted average returns of stocks that currently trade on GB exchanges.
Have feedback on this article? Concerned about the content? Get in touch with us directly. Alternatively, email editorial-team (at) simplywallst.com.
This article by Simply Wall St is general in nature. We provide commentary based on historical data and analyst forecasts only using an unbiased methodology and our articles are not intended to be financial advice. It does not constitute a recommendation to buy or sell any stock, and does not take account of your objectives, or your financial situation. We aim to bring you long-term focused analysis driven by fundamental data. Note that our analysis may not factor in the latest price-sensitive company announcements or qualitative material. Simply Wall St has no position in any stocks mentioned.
Join A Paid User Research Session
You’ll receive a US$30 Amazon Gift card for 1 hour of your time while helping us build better investing tools for the individual investors like yourself. Sign up here
