
 Yahoo Finance
 Investors three-year returns in Affiliated Managers Group (NYSE:AMG) have not grown faster than the company's underlying earnings growth
It might be of some concern to shareholders to see the Affiliated Managers Group, Inc. (NYSE:AMG) share price down 19% in the last month. But in three years the returns have been great. In fact, the share price is up a full 173% compared to three years ago. It's not uncommon to see a share price retrace a bit, after a big gain. The fundamental business performance will ultimately dictate whether the top is in, or if this is a stellar buying opportunity.
Since the long term performance has been good but there's been a recent pullback of 7.7%, let's check if the fundamentals match the share price.
See our latest analysis for Affiliated Managers Group
While the efficient markets hypothesis continues to be taught by some, it has been proven that markets are over-reactive dynamic systems, and investors are not always rational. One flawed but reasonable way to assess how sentiment around a company has changed is to compare the earnings per share (EPS) with the share price.
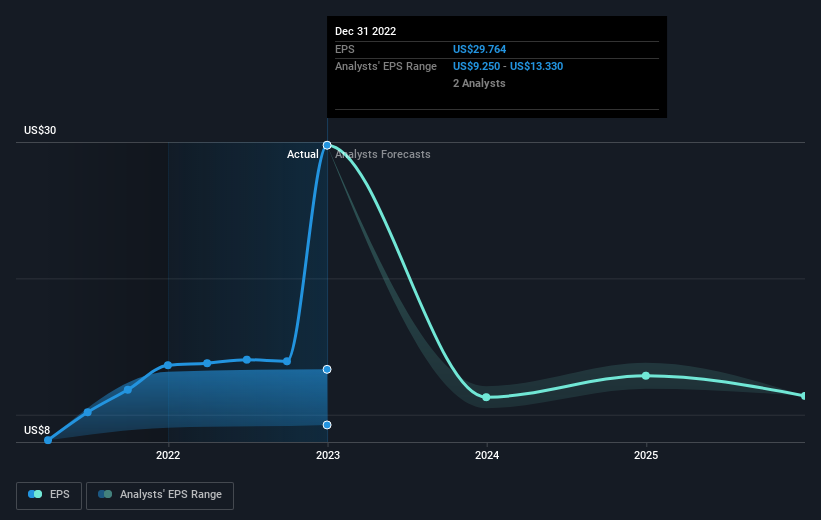
Affiliated Managers Group was able to grow its EPS at 368% per year over three years, sending the share price higher. This EPS growth is higher than the 40% average annual increase in the share price. So it seems investors have become more cautious about the company, over time. This cautious sentiment is reflected in its (fairly low) P/E ratio of 4.17.
You can see below how EPS has changed over time (discover the exact values by clicking on the image).
It's probably worth noting we've seen significant insider buying in the last quarter, which we consider a positive. That said, we think earnings and revenue growth trends are even more important factors to consider. Dive deeper into the earnings by checking this interactive graph of Affiliated Managers Group's earnings, revenue and cash flow.
A Different Perspective
Although it hurts that Affiliated Managers Group returned a loss of 6.5% in the last twelve months, the broader market was actually worse, returning a loss of 13%. Given the total loss of 4% per year over five years, it seems returns have deteriorated in the last twelve months. While some investors do well specializing in buying companies that are struggling (but nonetheless undervalued), don't forget that Buffett said that 'turnarounds seldom turn'. It's always interesting to track share price performance over the longer term. But to understand Affiliated Managers Group better, we need to consider many other factors. Case in point: We've spotted 2 warning signs for Affiliated Managers Group you should be aware of, and 1 of them is a bit unpleasant.
Affiliated Managers Group is not the only stock that insiders are buying. For those who like to find winning investments this free list of growing companies with recent insider purchasing, could be just the ticket.
Please note, the market returns quoted in this article reflect the market weighted average returns of stocks that currently trade on American exchanges.
Have feedback on this article? Concerned about the content? Get in touch with us directly. Alternatively, email editorial-team (at) simplywallst.com.
This article by Simply Wall St is general in nature. We provide commentary based on historical data and analyst forecasts only using an unbiased methodology and our articles are not intended to be financial advice. It does not constitute a recommendation to buy or sell any stock, and does not take account of your objectives, or your financial situation. We aim to bring you long-term focused analysis driven by fundamental data. Note that our analysis may not factor in the latest price-sensitive company announcements or qualitative material. Simply Wall St has no position in any stocks mentioned.
Join A Paid User Research Session
You’ll receive a US$30 Amazon Gift card for 1 hour of your time while helping us build better investing tools for the individual investors like yourself. Sign up here
