
 Yahoo Finance
 Investors in St Barbara (ASX:SBM) have unfortunately lost 81% over the last five years
Long term investing works well, but it doesn't always work for each individual stock. It hits us in the gut when we see fellow investors suffer a loss. For example, we sympathize with anyone who was caught holding St Barbara Limited (ASX:SBM) during the five years that saw its share price drop a whopping 83%. And some of the more recent buyers are probably worried, too, with the stock falling 66% in the last year. Furthermore, it's down 52% in about a quarter. That's not much fun for holders. We really hope anyone holding through that price crash has a diversified portfolio. Even when you lose money, you don't have to lose the lesson.
With that in mind, it's worth seeing if the company's underlying fundamentals have been the driver of long term performance, or if there are some discrepancies.
Check out our latest analysis for St Barbara
St Barbara isn't currently profitable, so most analysts would look to revenue growth to get an idea of how fast the underlying business is growing. Generally speaking, companies without profits are expected to grow revenue every year, and at a good clip. Some companies are willing to postpone profitability to grow revenue faster, but in that case one does expect good top-line growth.
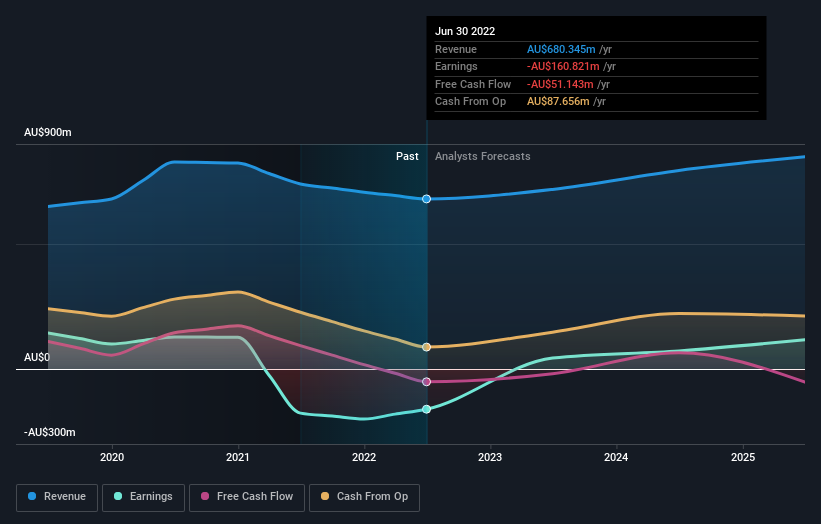
In the last half decade, St Barbara saw its revenue increase by 3.0% per year. That's far from impressive given all the money it is losing. Nonetheless, it's fair to say the rapidly declining share price (down 13%, compound, over five years) suggests the market is very disappointed with this level of growth. We'd be pretty cautious about this one, although the sell-off may be too severe. We'd recommend focussing any further research on the likelihood of profitability in the foreseeable future, given the muted revenue growth.
The graphic below depicts how earnings and revenue have changed over time (unveil the exact values by clicking on the image).
You can see how its balance sheet has strengthened (or weakened) over time in this free interactive graphic.
What About The Total Shareholder Return (TSR)?
We'd be remiss not to mention the difference between St Barbara's total shareholder return (TSR) and its share price return. The TSR is a return calculation that accounts for the value of cash dividends (assuming that any dividend received was reinvested) and the calculated value of any discounted capital raisings and spin-offs. Its history of dividend payouts mean that St Barbara's TSR, which was a 81% drop over the last 5 years, was not as bad as the share price return.
A Different Perspective
While the broader market lost about 6.2% in the twelve months, St Barbara shareholders did even worse, losing 66%. However, it could simply be that the share price has been impacted by broader market jitters. It might be worth keeping an eye on the fundamentals, in case there's a good opportunity. Regrettably, last year's performance caps off a bad run, with the shareholders facing a total loss of 13% per year over five years. We realise that Baron Rothschild has said investors should "buy when there is blood on the streets", but we caution that investors should first be sure they are buying a high quality business. It's always interesting to track share price performance over the longer term. But to understand St Barbara better, we need to consider many other factors. For example, we've discovered 1 warning sign for St Barbara that you should be aware of before investing here.
If you would prefer to check out another company -- one with potentially superior financials -- then do not miss this free list of companies that have proven they can grow earnings.
Please note, the market returns quoted in this article reflect the market weighted average returns of stocks that currently trade on AU exchanges.
Have feedback on this article? Concerned about the content? Get in touch with us directly. Alternatively, email editorial-team (at) simplywallst.com.
This article by Simply Wall St is general in nature. We provide commentary based on historical data and analyst forecasts only using an unbiased methodology and our articles are not intended to be financial advice. It does not constitute a recommendation to buy or sell any stock, and does not take account of your objectives, or your financial situation. We aim to bring you long-term focused analysis driven by fundamental data. Note that our analysis may not factor in the latest price-sensitive company announcements or qualitative material. Simply Wall St has no position in any stocks mentioned.
Join A Paid User Research Session
You’ll receive a US$30 Amazon Gift card for 1 hour of your time while helping us build better investing tools for the individual investors like yourself. Sign up here
