
 Yahoo Finance
 Investors Shouldn't Overlook Cadence Design Systems' (NASDAQ:CDNS) Impressive Returns On Capital
If you're looking for a multi-bagger, there's a few things to keep an eye out for. Ideally, a business will show two trends; firstly a growing return on capital employed (ROCE) and secondly, an increasing amount of capital employed. Basically this means that a company has profitable initiatives that it can continue to reinvest in, which is a trait of a compounding machine. With that in mind, the ROCE of Cadence Design Systems (NASDAQ:CDNS) looks great, so lets see what the trend can tell us.
What Is Return On Capital Employed (ROCE)?
If you haven't worked with ROCE before, it measures the 'return' (pre-tax profit) a company generates from capital employed in its business. To calculate this metric for Cadence Design Systems, this is the formula:
Return on Capital Employed = Earnings Before Interest and Tax (EBIT) ÷ (Total Assets - Current Liabilities)
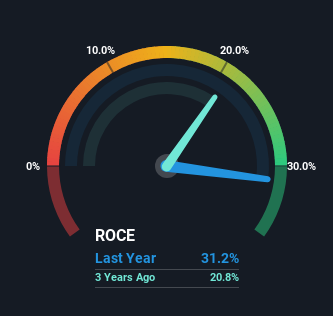
0.31 = US$1.3b ÷ (US$5.7b - US$1.6b) (Based on the trailing twelve months to December 2023).
So, Cadence Design Systems has an ROCE of 31%. In absolute terms that's a great return and it's even better than the Software industry average of 7.3%.
View our latest analysis for Cadence Design Systems
Above you can see how the current ROCE for Cadence Design Systems compares to its prior returns on capital, but there's only so much you can tell from the past. If you'd like to see what analysts are forecasting going forward, you should check out our free analyst report for Cadence Design Systems .
The Trend Of ROCE
Investors would be pleased with what's happening at Cadence Design Systems. The data shows that returns on capital have increased substantially over the last five years to 31%. The amount of capital employed has increased too, by 131%. This can indicate that there's plenty of opportunities to invest capital internally and at ever higher rates, a combination that's common among multi-baggers.
The Key Takeaway
In summary, it's great to see that Cadence Design Systems can compound returns by consistently reinvesting capital at increasing rates of return, because these are some of the key ingredients of those highly sought after multi-baggers. And with the stock having performed exceptionally well over the last five years, these patterns are being accounted for by investors. In light of that, we think it's worth looking further into this stock because if Cadence Design Systems can keep these trends up, it could have a bright future ahead.
While Cadence Design Systems looks impressive, no company is worth an infinite price. The intrinsic value infographic for CDNS helps visualize whether it is currently trading for a fair price.
If you want to search for more stocks that have been earning high returns, check out this free list of stocks with solid balance sheets that are also earning high returns on equity.
Have feedback on this article? Concerned about the content? Get in touch with us directly. Alternatively, email editorial-team (at) simplywallst.com.
This article by Simply Wall St is general in nature. We provide commentary based on historical data and analyst forecasts only using an unbiased methodology and our articles are not intended to be financial advice. It does not constitute a recommendation to buy or sell any stock, and does not take account of your objectives, or your financial situation. We aim to bring you long-term focused analysis driven by fundamental data. Note that our analysis may not factor in the latest price-sensitive company announcements or qualitative material. Simply Wall St has no position in any stocks mentioned.
