
 Yahoo Finance
 How Should Investors React To REA Group Limited’s (ASX:REA) CEO Pay?

Tracey Fellows took the helm as REA Group Limited’s (ASX:REA) CEO and grew market cap to AU$11.69B recently. Recognizing whether CEO incentives are aligned with shareholders is a crucial part of investing. This is because, if incentives are aligned, more value is created for shareholders which directly impacts your returns as an investor. Today we will assess Fellows’s pay and compare this to the company’s performance over the same period, as well as measure it against other Australian CEOs leading companies of similar size and profitability. See our latest analysis for REA Group
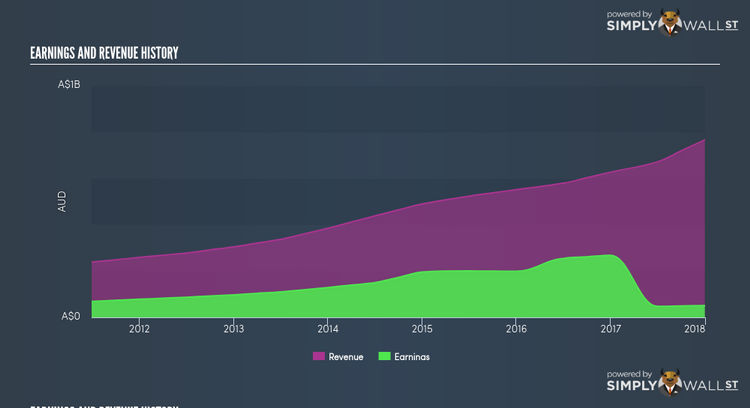
What has been the trend in REA’s earnings?
Profitability of a company is a strong indication of REA’s ability to generate returns on shareholders’ funds through corporate activities. In this exercise, I will use profits as a proxy for Fellows’s performance. Most recently, REA released a profit of AU$51.25M , which is a rather significant decline from its prior year’s profit (excluding extraordinary items) of AU$268.03M. However, REA has strived to sustain a strong track record of generating profits, given its average EPS of AU$1.02 over the past couple of years. During times of diminishing earnings, the company may be incurring a period of reinvestment and growth, or it can be a signal of some headwind. In any case, CEO compensation should emulate the current condition of the business. From the latest financial report, Fellows’s total remuneration increased by 34.16% to AU$2.37M. Furthermore, Fellows’s pay is also made up of 6.33% non-cash elements, which means that fluctuations in REA’s share price can move the true level of what the CEO actually collects at the end of the year.
Is REA overpaying the CEO?
Even though one size does not fit all, since compensation should be tailored to the specific company and market, we can estimate a high-level yardstick to see if REA deviates substantially from its peers. This outcome helps investors ask the right question about Fellows’s incentive alignment. Generally, an Australian large-cap has a value of $22.6B, produces earnings of $1.5B and remunerates its CEO circa $4.9M annually. Accounting for the size of REA in terms of market cap, as well as its performance, using earnings as a proxy, it seems that Fellows is compensated similar to other Australian CEOs of large-caps, on average. This may mean that REA is appropriately compensating its CEO.
Next Steps:
You can breathe easy knowing that shareholder funds aren’t being used to overpay REA’s CEO. However, on the flipside, you should ask whether Fellows is appropriately remunerated on the basis of retention. Its important for shareholders to be active in voting governance decisions, as board members are only representatives of investors’ voices. If you have not done so already, I urge you to complete your research by taking a look at the following:
Governance: To find out more about REA’s governance, look through our infographic report of the company’s board and management.
Financial Health: Does it have a healthy balance sheet? Take a look at our free balance sheet analysis with six simple checks on key factors like leverage and risk.
Other High-Growth Alternatives: Are there other high-growth stocks you could be holding instead of REA? Explore our interactive list of stocks with large growth potential to get an idea of what else is out there you may be missing!
To help readers see pass the short term volatility of the financial market, we aim to bring you a long-term focused research analysis purely driven by fundamental data. Note that our analysis does not factor in the latest price sensitive company announcements.
The author is an independent contributor and at the time of publication had no position in the stocks mentioned.
