
 Yahoo Finance
 Investors in Q & M Dental Group (Singapore) (SGX:QC7) have unfortunately lost 46% over the last year
The simplest way to benefit from a rising market is to buy an index fund. While individual stocks can be big winners, plenty more fail to generate satisfactory returns. Investors in Q & M Dental Group (Singapore) Limited (SGX:QC7) have tasted that bitter downside in the last year, as the share price dropped 47%. That's disappointing when you consider the market returned 5.5%. Longer term shareholders haven't suffered as badly, since the stock is down a comparatively less painful 22% in three years. The falls have accelerated recently, with the share price down 16% in the last three months.
With that in mind, it's worth seeing if the company's underlying fundamentals have been the driver of long term performance, or if there are some discrepancies.
Check out our latest analysis for Q & M Dental Group (Singapore)
To paraphrase Benjamin Graham: Over the short term the market is a voting machine, but over the long term it's a weighing machine. By comparing earnings per share (EPS) and share price changes over time, we can get a feel for how investor attitudes to a company have morphed over time.
Unfortunately Q & M Dental Group (Singapore) reported an EPS drop of 50% for the last year. We note that the 47% share price drop is very close to the EPS drop. So it seems that the market sentiment has not changed much, despite the weak results. Rather, the share price has approximately tracked EPS growth.
The graphic below depicts how EPS has changed over time (unveil the exact values by clicking on the image).
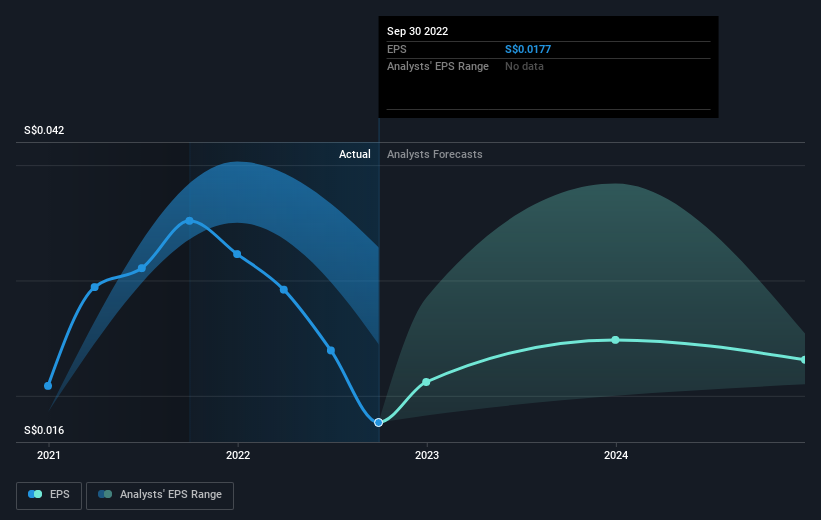
Dive deeper into Q & M Dental Group (Singapore)'s key metrics by checking this interactive graph of Q & M Dental Group (Singapore)'s earnings, revenue and cash flow.
A Different Perspective
While the broader market gained around 5.5% in the last year, Q & M Dental Group (Singapore) shareholders lost 46%. However, keep in mind that even the best stocks will sometimes underperform the market over a twelve month period. Regrettably, last year's performance caps off a bad run, with the shareholders facing a total loss of 5% per year over five years. Generally speaking long term share price weakness can be a bad sign, though contrarian investors might want to research the stock in hope of a turnaround. I find it very interesting to look at share price over the long term as a proxy for business performance. But to truly gain insight, we need to consider other information, too. Even so, be aware that Q & M Dental Group (Singapore) is showing 2 warning signs in our investment analysis , you should know about...
If you like to buy stocks alongside management, then you might just love this free list of companies. (Hint: insiders have been buying them).
Please note, the market returns quoted in this article reflect the market weighted average returns of stocks that currently trade on SG exchanges.
Have feedback on this article? Concerned about the content? Get in touch with us directly. Alternatively, email editorial-team (at) simplywallst.com.
This article by Simply Wall St is general in nature. We provide commentary based on historical data and analyst forecasts only using an unbiased methodology and our articles are not intended to be financial advice. It does not constitute a recommendation to buy or sell any stock, and does not take account of your objectives, or your financial situation. We aim to bring you long-term focused analysis driven by fundamental data. Note that our analysis may not factor in the latest price-sensitive company announcements or qualitative material. Simply Wall St has no position in any stocks mentioned.
Join A Paid User Research Session
You’ll receive a US$30 Amazon Gift card for 1 hour of your time while helping us build better investing tools for the individual investors like yourself. Sign up here
