
 Yahoo Finance
 Investors in Piper Sandler Companies (NYSE:PIPR) have seen solid returns of 224% over the past five years
The worst result, after buying shares in a company (assuming no leverage), would be if you lose all the money you put in. But on a lighter note, a good company can see its share price rise well over 100%. For instance, the price of Piper Sandler Companies (NYSE:PIPR) stock is up an impressive 174% over the last five years. It's down 1.9% in the last seven days.
With that in mind, it's worth seeing if the company's underlying fundamentals have been the driver of long term performance, or if there are some discrepancies.
Check out our latest analysis for Piper Sandler Companies
There is no denying that markets are sometimes efficient, but prices do not always reflect underlying business performance. One way to examine how market sentiment has changed over time is to look at the interaction between a company's share price and its earnings per share (EPS).
Over half a decade, Piper Sandler Companies managed to grow its earnings per share at 7.7% a year. This EPS growth is lower than the 22% average annual increase in the share price. So it's fair to assume the market has a higher opinion of the business than it did five years ago. And that's hardly shocking given the track record of growth.
The graphic below depicts how EPS has changed over time (unveil the exact values by clicking on the image).
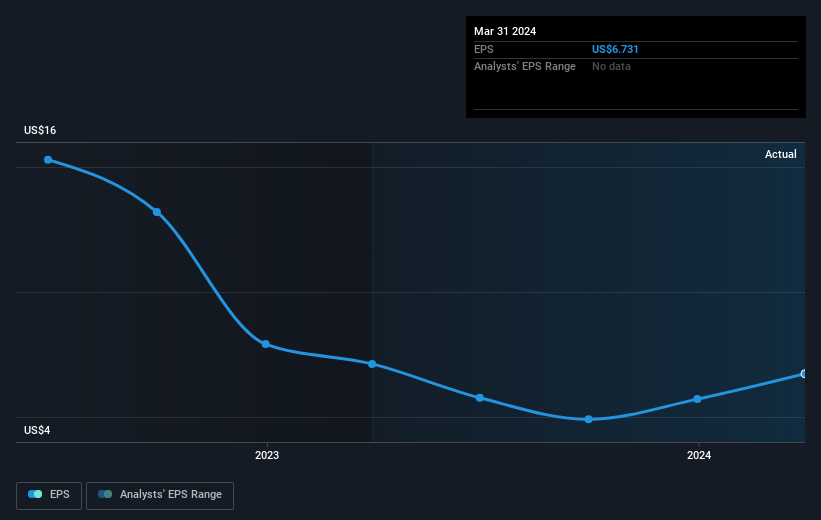
This free interactive report on Piper Sandler Companies' earnings, revenue and cash flow is a great place to start, if you want to investigate the stock further.
What About Dividends?
It is important to consider the total shareholder return, as well as the share price return, for any given stock. The TSR is a return calculation that accounts for the value of cash dividends (assuming that any dividend received was reinvested) and the calculated value of any discounted capital raisings and spin-offs. So for companies that pay a generous dividend, the TSR is often a lot higher than the share price return. In the case of Piper Sandler Companies, it has a TSR of 224% for the last 5 years. That exceeds its share price return that we previously mentioned. This is largely a result of its dividend payments!
A Different Perspective
It's good to see that Piper Sandler Companies has rewarded shareholders with a total shareholder return of 50% in the last twelve months. And that does include the dividend. Since the one-year TSR is better than the five-year TSR (the latter coming in at 26% per year), it would seem that the stock's performance has improved in recent times. In the best case scenario, this may hint at some real business momentum, implying that now could be a great time to delve deeper. While it is well worth considering the different impacts that market conditions can have on the share price, there are other factors that are even more important. Case in point: We've spotted 3 warning signs for Piper Sandler Companies you should be aware of.
Of course Piper Sandler Companies may not be the best stock to buy. So you may wish to see this free collection of growth stocks.
Please note, the market returns quoted in this article reflect the market weighted average returns of stocks that currently trade on American exchanges.
Have feedback on this article? Concerned about the content? Get in touch with us directly. Alternatively, email editorial-team (at) simplywallst.com.
This article by Simply Wall St is general in nature. We provide commentary based on historical data and analyst forecasts only using an unbiased methodology and our articles are not intended to be financial advice. It does not constitute a recommendation to buy or sell any stock, and does not take account of your objectives, or your financial situation. We aim to bring you long-term focused analysis driven by fundamental data. Note that our analysis may not factor in the latest price-sensitive company announcements or qualitative material. Simply Wall St has no position in any stocks mentioned.
