
 Yahoo Finance
 Investors in OM Holdings (ASX:OMH) have unfortunately lost 63% over the last five years
Generally speaking long term investing is the way to go. But that doesn't mean long term investors can avoid big losses. For example the OM Holdings Limited (ASX:OMH) share price dropped 67% over five years. That is extremely sub-optimal, to say the least. And some of the more recent buyers are probably worried, too, with the stock falling 29% in the last year. Shareholders have had an even rougher run lately, with the share price down 17% in the last 90 days. Of course, this share price action may well have been influenced by the 7.3% decline in the broader market, throughout the period.
Since shareholders are down over the longer term, lets look at the underlying fundamentals over the that time and see if they've been consistent with returns.
See our latest analysis for OM Holdings
While markets are a powerful pricing mechanism, share prices reflect investor sentiment, not just underlying business performance. By comparing earnings per share (EPS) and share price changes over time, we can get a feel for how investor attitudes to a company have morphed over time.
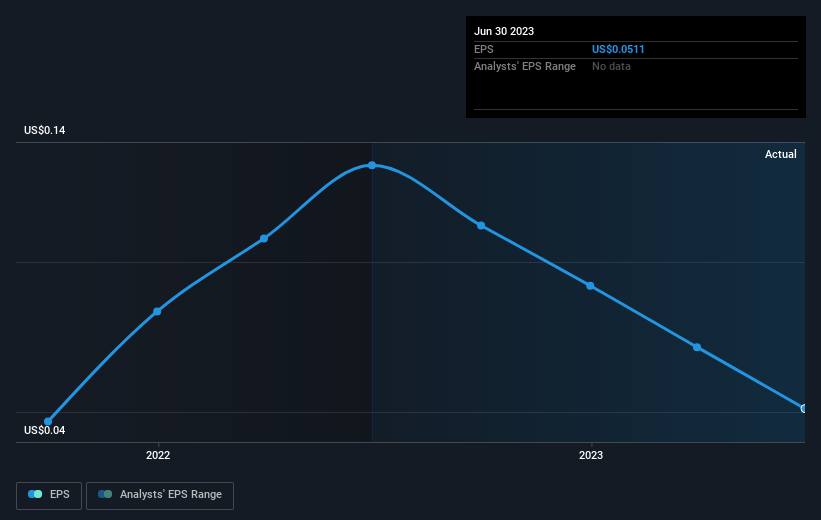
During the five years over which the share price declined, OM Holdings' earnings per share (EPS) dropped by 24% each year. This change in EPS is reasonably close to the 20% average annual decrease in the share price. This implies that the market has had a fairly steady view of the stock. Rather, the share price has approximately tracked EPS growth.
You can see how EPS has changed over time in the image below (click on the chart to see the exact values).
It is of course excellent to see how OM Holdings has grown profits over the years, but the future is more important for shareholders. This free interactive report on OM Holdings' balance sheet strength is a great place to start, if you want to investigate the stock further.
What About Dividends?
It is important to consider the total shareholder return, as well as the share price return, for any given stock. The TSR is a return calculation that accounts for the value of cash dividends (assuming that any dividend received was reinvested) and the calculated value of any discounted capital raisings and spin-offs. It's fair to say that the TSR gives a more complete picture for stocks that pay a dividend. In the case of OM Holdings, it has a TSR of -63% for the last 5 years. That exceeds its share price return that we previously mentioned. And there's no prize for guessing that the dividend payments largely explain the divergence!
A Different Perspective
While the broader market gained around 4.5% in the last year, OM Holdings shareholders lost 27% (even including dividends). However, keep in mind that even the best stocks will sometimes underperform the market over a twelve month period. Regrettably, last year's performance caps off a bad run, with the shareholders facing a total loss of 10% per year over five years. Generally speaking long term share price weakness can be a bad sign, though contrarian investors might want to research the stock in hope of a turnaround. While it is well worth considering the different impacts that market conditions can have on the share price, there are other factors that are even more important. Consider for instance, the ever-present spectre of investment risk. We've identified 3 warning signs with OM Holdings , and understanding them should be part of your investment process.
For those who like to find winning investments this free list of growing companies with recent insider purchasing, could be just the ticket.
Please note, the market returns quoted in this article reflect the market weighted average returns of stocks that currently trade on Australian exchanges.
Have feedback on this article? Concerned about the content? Get in touch with us directly. Alternatively, email editorial-team (at) simplywallst.com.
This article by Simply Wall St is general in nature. We provide commentary based on historical data and analyst forecasts only using an unbiased methodology and our articles are not intended to be financial advice. It does not constitute a recommendation to buy or sell any stock, and does not take account of your objectives, or your financial situation. We aim to bring you long-term focused analysis driven by fundamental data. Note that our analysis may not factor in the latest price-sensitive company announcements or qualitative material. Simply Wall St has no position in any stocks mentioned.
