
 Yahoo Finance
 Investors in MetLife (NYSE:MET) have seen respectable returns of 59% over the past three years
It hasn't been the best quarter for MetLife, Inc. (NYSE:MET) shareholders, since the share price has fallen 28% in that time. But we wouldn't complain about the gain over the last three years. After all, the stock has performed better than the market (40%) over that time, over which it gained 44%.
Let's take a look at the underlying fundamentals over the longer term, and see if they've been consistent with shareholders returns.
See our latest analysis for MetLife
To paraphrase Benjamin Graham: Over the short term the market is a voting machine, but over the long term it's a weighing machine. One imperfect but simple way to consider how the market perception of a company has shifted is to compare the change in the earnings per share (EPS) with the share price movement.
Over the last three years, MetLife failed to grow earnings per share, which fell 52% (annualized).
Thus, it seems unlikely that the market is focussed on EPS growth at the moment. Since the change in EPS doesn't seem to correlate with the change in share price, it's worth taking a look at other metrics.
We note that the dividend is higher than it was preciously, so that may have assisted the share price. It could be that the company is reaching maturity and dividend investors are buying for the yield.
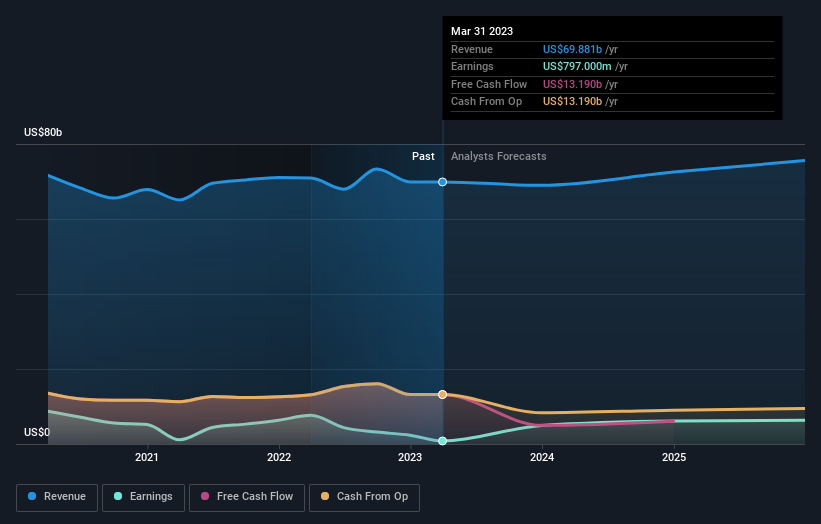
The company's revenue and earnings (over time) are depicted in the image below (click to see the exact numbers).
MetLife is well known by investors, and plenty of clever analysts have tried to predict the future profit levels. You can see what analysts are predicting for MetLife in this interactive graph of future profit estimates.
What About Dividends?
When looking at investment returns, it is important to consider the difference between total shareholder return (TSR) and share price return. Whereas the share price return only reflects the change in the share price, the TSR includes the value of dividends (assuming they were reinvested) and the benefit of any discounted capital raising or spin-off. It's fair to say that the TSR gives a more complete picture for stocks that pay a dividend. As it happens, MetLife's TSR for the last 3 years was 59%, which exceeds the share price return mentioned earlier. And there's no prize for guessing that the dividend payments largely explain the divergence!
A Different Perspective
Investors in MetLife had a tough year, with a total loss of 21% (including dividends), against a market gain of about 1.0%. Even the share prices of good stocks drop sometimes, but we want to see improvements in the fundamental metrics of a business, before getting too interested. Longer term investors wouldn't be so upset, since they would have made 6%, each year, over five years. It could be that the recent sell-off is an opportunity, so it may be worth checking the fundamental data for signs of a long term growth trend. It's always interesting to track share price performance over the longer term. But to understand MetLife better, we need to consider many other factors. Take risks, for example - MetLife has 3 warning signs (and 1 which is a bit concerning) we think you should know about.
If you would prefer to check out another company -- one with potentially superior financials -- then do not miss this free list of companies that have proven they can grow earnings.
Please note, the market returns quoted in this article reflect the market weighted average returns of stocks that currently trade on American exchanges.
Have feedback on this article? Concerned about the content? Get in touch with us directly. Alternatively, email editorial-team (at) simplywallst.com.
This article by Simply Wall St is general in nature. We provide commentary based on historical data and analyst forecasts only using an unbiased methodology and our articles are not intended to be financial advice. It does not constitute a recommendation to buy or sell any stock, and does not take account of your objectives, or your financial situation. We aim to bring you long-term focused analysis driven by fundamental data. Note that our analysis may not factor in the latest price-sensitive company announcements or qualitative material. Simply Wall St has no position in any stocks mentioned.
Join A Paid User Research Session
You’ll receive a US$30 Amazon Gift card for 1 hour of your time while helping us build better investing tools for the individual investors like yourself. Sign up here
