
 Yahoo Finance
 Investors Met With Slowing Returns on Capital At Acuity Brands (NYSE:AYI)
If we want to find a potential multi-bagger, often there are underlying trends that can provide clues. Ideally, a business will show two trends; firstly a growing return on capital employed (ROCE) and secondly, an increasing amount of capital employed. This shows us that it's a compounding machine, able to continually reinvest its earnings back into the business and generate higher returns. With that in mind, the ROCE of Acuity Brands (NYSE:AYI) looks decent, right now, so lets see what the trend of returns can tell us.
Understanding Return On Capital Employed (ROCE)
For those that aren't sure what ROCE is, it measures the amount of pre-tax profits a company can generate from the capital employed in its business. The formula for this calculation on Acuity Brands is:
Return on Capital Employed = Earnings Before Interest and Tax (EBIT) ÷ (Total Assets - Current Liabilities)
0.18 = US$515m ÷ (US$3.5b - US$598m) (Based on the trailing twelve months to February 2024).
Therefore, Acuity Brands has an ROCE of 18%. On its own, that's a standard return, however it's much better than the 13% generated by the Electrical industry.
Check out our latest analysis for Acuity Brands
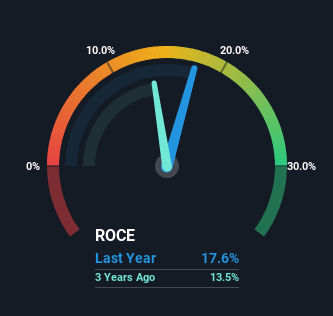
Above you can see how the current ROCE for Acuity Brands compares to its prior returns on capital, but there's only so much you can tell from the past. If you'd like to see what analysts are forecasting going forward, you should check out our free analyst report for Acuity Brands .
The Trend Of ROCE
While the current returns on capital are decent, they haven't changed much. The company has consistently earned 18% for the last five years, and the capital employed within the business has risen 22% in that time. 18% is a pretty standard return, and it provides some comfort knowing that Acuity Brands has consistently earned this amount. Stable returns in this ballpark can be unexciting, but if they can be maintained over the long run, they often provide nice rewards to shareholders.
The Key Takeaway
To sum it up, Acuity Brands has simply been reinvesting capital steadily, at those decent rates of return. And the stock has followed suit returning a meaningful 91% to shareholders over the last five years. So even though the stock might be more "expensive" than it was before, we think the strong fundamentals warrant this stock for further research.
One more thing to note, we've identified 1 warning sign with Acuity Brands and understanding this should be part of your investment process.
If you want to search for solid companies with great earnings, check out this free list of companies with good balance sheets and impressive returns on equity.
Have feedback on this article? Concerned about the content? Get in touch with us directly. Alternatively, email editorial-team (at) simplywallst.com.
This article by Simply Wall St is general in nature. We provide commentary based on historical data and analyst forecasts only using an unbiased methodology and our articles are not intended to be financial advice. It does not constitute a recommendation to buy or sell any stock, and does not take account of your objectives, or your financial situation. We aim to bring you long-term focused analysis driven by fundamental data. Note that our analysis may not factor in the latest price-sensitive company announcements or qualitative material. Simply Wall St has no position in any stocks mentioned.
Have feedback on this article? Concerned about the content? Get in touch with us directly. Alternatively, email editorial-team@simplywallst.com
