
 Yahoo Finance
 Investors Met With Slowing Returns on Capital At Pediatrix Medical Group (NYSE:MD)
To find a multi-bagger stock, what are the underlying trends we should look for in a business? Firstly, we'll want to see a proven return on capital employed (ROCE) that is increasing, and secondly, an expanding base of capital employed. Put simply, these types of businesses are compounding machines, meaning they are continually reinvesting their earnings at ever-higher rates of return. Having said that, from a first glance at Pediatrix Medical Group (NYSE:MD) we aren't jumping out of our chairs at how returns are trending, but let's have a deeper look.
Understanding Return On Capital Employed (ROCE)
Just to clarify if you're unsure, ROCE is a metric for evaluating how much pre-tax income (in percentage terms) a company earns on the capital invested in its business. The formula for this calculation on Pediatrix Medical Group is:
Return on Capital Employed = Earnings Before Interest and Tax (EBIT) ÷ (Total Assets - Current Liabilities)
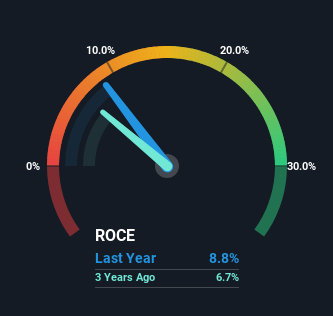
0.088 = US$174m ÷ (US$2.3b - US$350m) (Based on the trailing twelve months to September 2023).
So, Pediatrix Medical Group has an ROCE of 8.8%. In absolute terms, that's a low return but it's around the Healthcare industry average of 9.9%.
See our latest analysis for Pediatrix Medical Group
In the above chart we have measured Pediatrix Medical Group's prior ROCE against its prior performance, but the future is arguably more important. If you'd like, you can check out the forecasts from the analysts covering Pediatrix Medical Group here for free.
What The Trend Of ROCE Can Tell Us
We've noticed that although returns on capital are flat over the last five years, the amount of capital employed in the business has fallen 63% in that same period. When a company effectively decreases its assets base, it's not usually a sign to be optimistic on that company. Not only that, but the low returns on this capital mentioned earlier would leave most investors unimpressed.
In Conclusion...
Overall, we're not ecstatic to see Pediatrix Medical Group reducing the amount of capital it employs in the business. And investors may be expecting the fundamentals to get a lot worse because the stock has crashed 77% over the last five years. On the whole, we aren't too inspired by the underlying trends and we think there may be better chances of finding a multi-bagger elsewhere.
If you want to know some of the risks facing Pediatrix Medical Group we've found 2 warning signs (1 is concerning!) that you should be aware of before investing here.
While Pediatrix Medical Group isn't earning the highest return, check out this free list of companies that are earning high returns on equity with solid balance sheets.
Have feedback on this article? Concerned about the content? Get in touch with us directly. Alternatively, email editorial-team (at) simplywallst.com.
This article by Simply Wall St is general in nature. We provide commentary based on historical data and analyst forecasts only using an unbiased methodology and our articles are not intended to be financial advice. It does not constitute a recommendation to buy or sell any stock, and does not take account of your objectives, or your financial situation. We aim to bring you long-term focused analysis driven by fundamental data. Note that our analysis may not factor in the latest price-sensitive company announcements or qualitative material. Simply Wall St has no position in any stocks mentioned.
