
 Yahoo Finance
 Some Investors May Be Worried About Trade Desk's (NASDAQ:TTD) Returns On Capital
Did you know there are some financial metrics that can provide clues of a potential multi-bagger? In a perfect world, we'd like to see a company investing more capital into its business and ideally the returns earned from that capital are also increasing. Put simply, these types of businesses are compounding machines, meaning they are continually reinvesting their earnings at ever-higher rates of return. However, after investigating Trade Desk (NASDAQ:TTD), we don't think it's current trends fit the mold of a multi-bagger.
Return On Capital Employed (ROCE): What Is It?
For those who don't know, ROCE is a measure of a company's yearly pre-tax profit (its return), relative to the capital employed in the business. The formula for this calculation on Trade Desk is:
Return on Capital Employed = Earnings Before Interest and Tax (EBIT) ÷ (Total Assets - Current Liabilities)
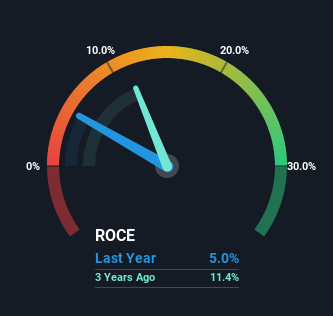
0.05 = US$107m ÷ (US$4.0b - US$1.8b) (Based on the trailing twelve months to March 2023).
Thus, Trade Desk has an ROCE of 5.0%. Ultimately, that's a low return and it under-performs the Media industry average of 9.4%.
See our latest analysis for Trade Desk
In the above chart we have measured Trade Desk's prior ROCE against its prior performance, but the future is arguably more important. If you're interested, you can view the analysts predictions in our free report on analyst forecasts for the company.
So How Is Trade Desk's ROCE Trending?
When we looked at the ROCE trend at Trade Desk, we didn't gain much confidence. Over the last five years, returns on capital have decreased to 5.0% from 29% five years ago. Although, given both revenue and the amount of assets employed in the business have increased, it could suggest the company is investing in growth, and the extra capital has led to a short-term reduction in ROCE. If these investments prove successful, this can bode very well for long term stock performance.
On a related note, Trade Desk has decreased its current liabilities to 46% of total assets. So we could link some of this to the decrease in ROCE. Effectively this means their suppliers or short-term creditors are funding less of the business, which reduces some elements of risk. Since the business is basically funding more of its operations with it's own money, you could argue this has made the business less efficient at generating ROCE. Keep in mind 46% is still pretty high, so those risks are still somewhat prevalent.
The Key Takeaway
In summary, despite lower returns in the short term, we're encouraged to see that Trade Desk is reinvesting for growth and has higher sales as a result. And long term investors must be optimistic going forward because the stock has returned a huge 671% to shareholders in the last five years. So while the underlying trends could already be accounted for by investors, we still think this stock is worth looking into further.
One more thing, we've spotted 1 warning sign facing Trade Desk that you might find interesting.
While Trade Desk isn't earning the highest return, check out this free list of companies that are earning high returns on equity with solid balance sheets.
Have feedback on this article? Concerned about the content? Get in touch with us directly. Alternatively, email editorial-team (at) simplywallst.com.
This article by Simply Wall St is general in nature. We provide commentary based on historical data and analyst forecasts only using an unbiased methodology and our articles are not intended to be financial advice. It does not constitute a recommendation to buy or sell any stock, and does not take account of your objectives, or your financial situation. We aim to bring you long-term focused analysis driven by fundamental data. Note that our analysis may not factor in the latest price-sensitive company announcements or qualitative material. Simply Wall St has no position in any stocks mentioned.
Join A Paid User Research Session
You’ll receive a US$30 Amazon Gift card for 1 hour of your time while helping us build better investing tools for the individual investors like yourself. Sign up here
