
 Yahoo Finance
 Some Investors May Be Worried About Rand Mining's (ASX:RND) Returns On Capital
When it comes to investing, there are some useful financial metrics that can warn us when a business is potentially in trouble. When we see a declining return on capital employed (ROCE) in conjunction with a declining base of capital employed, that's often how a mature business shows signs of aging. Trends like this ultimately mean the business is reducing its investments and also earning less on what it has invested. In light of that, from a first glance at Rand Mining (ASX:RND), we've spotted some signs that it could be struggling, so let's investigate.
Understanding Return On Capital Employed (ROCE)
Just to clarify if you're unsure, ROCE is a metric for evaluating how much pre-tax income (in percentage terms) a company earns on the capital invested in its business. The formula for this calculation on Rand Mining is:
Return on Capital Employed = Earnings Before Interest and Tax (EBIT) ÷ (Total Assets - Current Liabilities)
0.12 = AU$12m ÷ (AU$102m - AU$2.2m) (Based on the trailing twelve months to June 2023).
Therefore, Rand Mining has an ROCE of 12%. On its own, that's a standard return, however it's much better than the 9.0% generated by the Metals and Mining industry.
View our latest analysis for Rand Mining
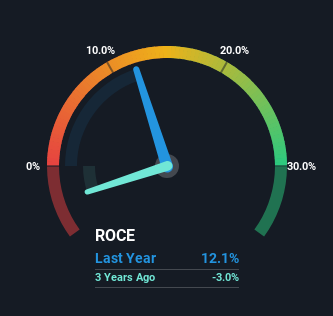
Historical performance is a great place to start when researching a stock so above you can see the gauge for Rand Mining's ROCE against it's prior returns. If you'd like to look at how Rand Mining has performed in the past in other metrics, you can view this free graph of past earnings, revenue and cash flow.
What The Trend Of ROCE Can Tell Us
In terms of Rand Mining's historical ROCE movements, the trend doesn't inspire confidence. To be more specific, the ROCE was 15% five years ago, but since then it has dropped noticeably. Meanwhile, capital employed in the business has stayed roughly the flat over the period. Companies that exhibit these attributes tend to not be shrinking, but they can be mature and facing pressure on their margins from competition. So because these trends aren't typically conducive to creating a multi-bagger, we wouldn't hold our breath on Rand Mining becoming one if things continue as they have.
In Conclusion...
In the end, the trend of lower returns on the same amount of capital isn't typically an indication that we're looking at a growth stock. And long term shareholders have watched their investments stay flat over the last five years. Unless there is a shift to a more positive trajectory in these metrics, we would look elsewhere.
If you want to know some of the risks facing Rand Mining we've found 4 warning signs (2 are a bit unpleasant!) that you should be aware of before investing here.
While Rand Mining isn't earning the highest return, check out this free list of companies that are earning high returns on equity with solid balance sheets.
Have feedback on this article? Concerned about the content? Get in touch with us directly. Alternatively, email editorial-team (at) simplywallst.com.
This article by Simply Wall St is general in nature. We provide commentary based on historical data and analyst forecasts only using an unbiased methodology and our articles are not intended to be financial advice. It does not constitute a recommendation to buy or sell any stock, and does not take account of your objectives, or your financial situation. We aim to bring you long-term focused analysis driven by fundamental data. Note that our analysis may not factor in the latest price-sensitive company announcements or qualitative material. Simply Wall St has no position in any stocks mentioned.
