
 Yahoo Finance
 Some Investors May Be Worried About FFI Holdings' (ASX:FFI) Returns On Capital
To find a multi-bagger stock, what are the underlying trends we should look for in a business? Ideally, a business will show two trends; firstly a growing return on capital employed (ROCE) and secondly, an increasing amount of capital employed. If you see this, it typically means it's a company with a great business model and plenty of profitable reinvestment opportunities. Although, when we looked at FFI Holdings (ASX:FFI), it didn't seem to tick all of these boxes.
Return On Capital Employed (ROCE): What Is It?
If you haven't worked with ROCE before, it measures the 'return' (pre-tax profit) a company generates from capital employed in its business. Analysts use this formula to calculate it for FFI Holdings:
Return on Capital Employed = Earnings Before Interest and Tax (EBIT) ÷ (Total Assets - Current Liabilities)
0.046 = AU$2.3m ÷ (AU$57m - AU$5.6m) (Based on the trailing twelve months to June 2023).
Therefore, FFI Holdings has an ROCE of 4.6%. On its own that's a low return on capital but it's in line with the industry's average returns of 5.0%.
See our latest analysis for FFI Holdings
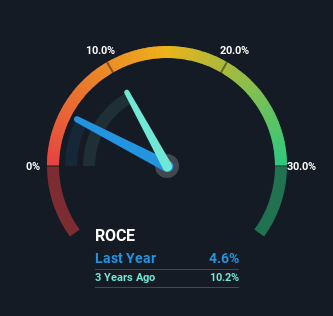
Historical performance is a great place to start when researching a stock so above you can see the gauge for FFI Holdings' ROCE against it's prior returns. If you're interested in investigating FFI Holdings' past further, check out this free graph of past earnings, revenue and cash flow.
The Trend Of ROCE
On the surface, the trend of ROCE at FFI Holdings doesn't inspire confidence. Over the last five years, returns on capital have decreased to 4.6% from 8.7% five years ago. Although, given both revenue and the amount of assets employed in the business have increased, it could suggest the company is investing in growth, and the extra capital has led to a short-term reduction in ROCE. If these investments prove successful, this can bode very well for long term stock performance.
What We Can Learn From FFI Holdings' ROCE
In summary, despite lower returns in the short term, we're encouraged to see that FFI Holdings is reinvesting for growth and has higher sales as a result. Furthermore the stock has climbed 49% over the last five years, it would appear that investors are upbeat about the future. So while the underlying trends could already be accounted for by investors, we still think this stock is worth looking into further.
One final note, you should learn about the 2 warning signs we've spotted with FFI Holdings (including 1 which doesn't sit too well with us) .
While FFI Holdings may not currently earn the highest returns, we've compiled a list of companies that currently earn more than 25% return on equity. Check out this free list here.
Have feedback on this article? Concerned about the content? Get in touch with us directly. Alternatively, email editorial-team (at) simplywallst.com.
This article by Simply Wall St is general in nature. We provide commentary based on historical data and analyst forecasts only using an unbiased methodology and our articles are not intended to be financial advice. It does not constitute a recommendation to buy or sell any stock, and does not take account of your objectives, or your financial situation. We aim to bring you long-term focused analysis driven by fundamental data. Note that our analysis may not factor in the latest price-sensitive company announcements or qualitative material. Simply Wall St has no position in any stocks mentioned.
