
 Yahoo Finance
 Some Investors May Be Worried About Centrica's (LON:CNA) Returns On Capital
When we're researching a company, it's sometimes hard to find the warning signs, but there are some financial metrics that can help spot trouble early. When we see a declining return on capital employed (ROCE) in conjunction with a declining base of capital employed, that's often how a mature business shows signs of aging. This combination can tell you that not only is the company investing less, it's earning less on what it does invest. Having said that, after a brief look, Centrica (LON:CNA) we aren't filled with optimism, but let's investigate further.
Return On Capital Employed (ROCE): What is it?
If you haven't worked with ROCE before, it measures the 'return' (pre-tax profit) a company generates from capital employed in its business. The formula for this calculation on Centrica is:
Return on Capital Employed = Earnings Before Interest and Tax (EBIT) ÷ (Total Assets - Current Liabilities)
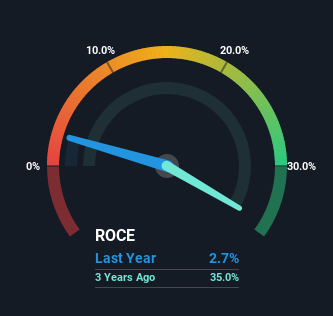
0.027 = UK£244m ÷ (UK£27b - UK£18b) (Based on the trailing twelve months to December 2021).
So, Centrica has an ROCE of 2.7%. In absolute terms, that's a low return and it also under-performs the Integrated Utilities industry average of 5.5%.
See our latest analysis for Centrica
In the above chart we have measured Centrica's prior ROCE against its prior performance, but the future is arguably more important. If you'd like, you can check out the forecasts from the analysts covering Centrica here for free.
What Can We Tell From Centrica's ROCE Trend?
In terms of Centrica's historical ROCE trend, it isn't fantastic. To be more specific, today's ROCE was 9.5% five years ago but has since fallen to 2.7%. On top of that, the business is utilizing 35% less capital within its operations. The combination of lower ROCE and less capital employed can indicate that a business is likely to be facing some competitive headwinds or seeing an erosion to its moat. Typically businesses that exhibit these characteristics aren't the ones that tend to multiply over the long term, because statistically speaking, they've already gone through the growth phase of their life cycle.
On a side note, Centrica's current liabilities have increased over the last five years to 66% of total assets, effectively distorting the ROCE to some degree. If current liabilities hadn't increased as much as they did, the ROCE could actually be even lower. What this means is that in reality, a rather large portion of the business is being funded by the likes of the company's suppliers or short-term creditors, which can bring some risks of its own.
Our Take On Centrica's ROCE
In short, lower returns and decreasing amounts capital employed in the business doesn't fill us with confidence. It should come as no surprise then that the stock has fallen 53% over the last five years, so it looks like investors are recognizing these changes. That being the case, unless the underlying trends revert to a more positive trajectory, we'd consider looking elsewhere.
Centrica does have some risks, we noticed 2 warning signs (and 1 which is a bit concerning) we think you should know about.
While Centrica may not currently earn the highest returns, we've compiled a list of companies that currently earn more than 25% return on equity. Check out this free list here.
Have feedback on this article? Concerned about the content? Get in touch with us directly. Alternatively, email editorial-team (at) simplywallst.com.
This article by Simply Wall St is general in nature. We provide commentary based on historical data and analyst forecasts only using an unbiased methodology and our articles are not intended to be financial advice. It does not constitute a recommendation to buy or sell any stock, and does not take account of your objectives, or your financial situation. We aim to bring you long-term focused analysis driven by fundamental data. Note that our analysis may not factor in the latest price-sensitive company announcements or qualitative material. Simply Wall St has no position in any stocks mentioned.
