
 Yahoo Finance
 Investors in LyondellBasell Industries (NYSE:LYB) have made a stellar return of 153% over the past three years
It might be of some concern to shareholders to see the LyondellBasell Industries N.V. (NYSE:LYB) share price down 13% in the last month. But in three years the returns have been great. The share price marched upwards over that time, and is now 109% higher than it was. After a run like that some may not be surprised to see prices moderate. If the business can perform well for years to come, then the recent drop could be an opportunity.
So let's investigate and see if the longer term performance of the company has been in line with the underlying business' progress.
See our latest analysis for LyondellBasell Industries
To paraphrase Benjamin Graham: Over the short term the market is a voting machine, but over the long term it's a weighing machine. One flawed but reasonable way to assess how sentiment around a company has changed is to compare the earnings per share (EPS) with the share price.
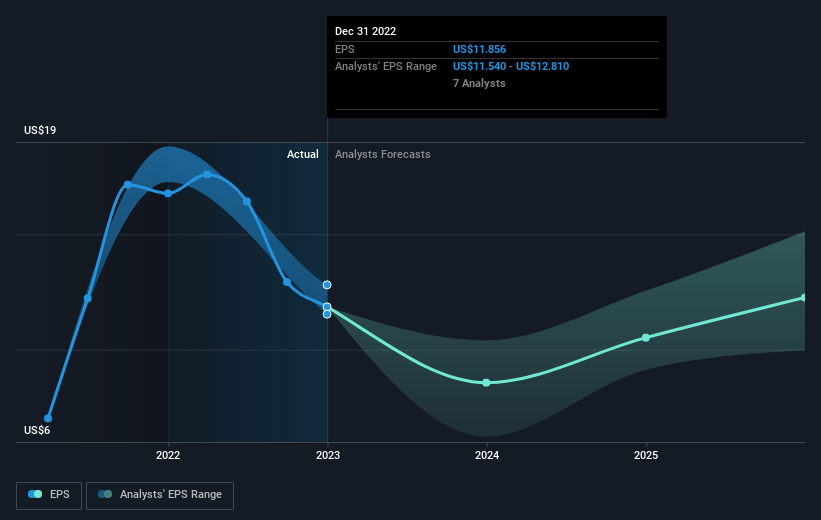
LyondellBasell Industries was able to grow its EPS at 7.4% per year over three years, sending the share price higher. This EPS growth is lower than the 28% average annual increase in the share price. This suggests that, as the business progressed over the last few years, it gained the confidence of market participants. It's not unusual to see the market 're-rate' a stock, after a few years of growth.
The company's earnings per share (over time) is depicted in the image below (click to see the exact numbers).
Before buying or selling a stock, we always recommend a close examination of historic growth trends, available here.
What About Dividends?
When looking at investment returns, it is important to consider the difference between total shareholder return (TSR) and share price return. The TSR is a return calculation that accounts for the value of cash dividends (assuming that any dividend received was reinvested) and the calculated value of any discounted capital raisings and spin-offs. Arguably, the TSR gives a more comprehensive picture of the return generated by a stock. In the case of LyondellBasell Industries, it has a TSR of 153% for the last 3 years. That exceeds its share price return that we previously mentioned. This is largely a result of its dividend payments!
A Different Perspective
The total return of 11% received by LyondellBasell Industries shareholders over the last year isn't far from the market return of -12%. Longer term investors wouldn't be so upset, since they would have made 1.4%, each year, over five years. If the fundamental data remains strong, and the share price is simply down on sentiment, then this could be an opportunity worth investigating. It's always interesting to track share price performance over the longer term. But to understand LyondellBasell Industries better, we need to consider many other factors. Take risks, for example - LyondellBasell Industries has 4 warning signs we think you should be aware of.
If you would prefer to check out another company -- one with potentially superior financials -- then do not miss this free list of companies that have proven they can grow earnings.
Please note, the market returns quoted in this article reflect the market weighted average returns of stocks that currently trade on American exchanges.
Have feedback on this article? Concerned about the content? Get in touch with us directly. Alternatively, email editorial-team (at) simplywallst.com.
This article by Simply Wall St is general in nature. We provide commentary based on historical data and analyst forecasts only using an unbiased methodology and our articles are not intended to be financial advice. It does not constitute a recommendation to buy or sell any stock, and does not take account of your objectives, or your financial situation. We aim to bring you long-term focused analysis driven by fundamental data. Note that our analysis may not factor in the latest price-sensitive company announcements or qualitative material. Simply Wall St has no position in any stocks mentioned.
Join A Paid User Research Session
You’ll receive a US$30 Amazon Gift card for 1 hour of your time while helping us build better investing tools for the individual investors like yourself. Sign up here
