
 Yahoo Finance
 What Investors Should Know About IDP Education Limited's (ASX:IEL) Financial Strength

Want to participate in a short research study? Help shape the future of investing tools and you could win a $250 gift card!
While small-cap stocks, such as IDP Education Limited (ASX:IEL) with its market cap of AU$4.3b, are popular for their explosive growth, investors should also be aware of their balance sheet to judge whether the company can survive a downturn. Evaluating financial health as part of your investment thesis is crucial, since poor capital management may bring about bankruptcies, which occur at a higher rate for small-caps. We'll look at some basic checks that can form a snapshot the company’s financial strength. However, this is not a comprehensive overview, so I’d encourage you to dig deeper yourself into IEL here.
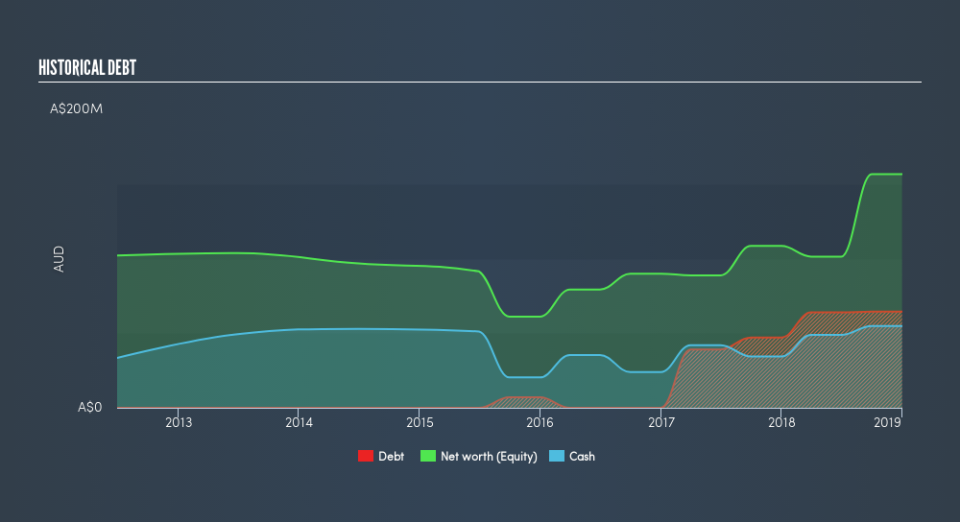
IEL’s Debt (And Cash Flows)
IEL has built up its total debt levels in the last twelve months, from AU$47m to AU$64m , which includes long-term debt. With this increase in debt, the current cash and short-term investment levels stands at AU$55m to keep the business going. Additionally, IEL has generated cash from operations of AU$84m in the last twelve months, leading to an operating cash to total debt ratio of 130%, signalling that IEL’s current level of operating cash is high enough to cover debt.
Can IEL meet its short-term obligations with the cash in hand?
With current liabilities at AU$134m, it appears that the company has maintained a safe level of current assets to meet its obligations, with the current ratio last standing at 1.34x. The current ratio is calculated by dividing current assets by current liabilities. Generally, for Consumer Services companies, this is a reasonable ratio as there's enough of a cash buffer without holding too much capital in low return investments.
Is IEL’s debt level acceptable?
With debt reaching 41% of equity, IEL may be thought of as relatively highly levered. This is somewhat unusual for small-caps companies, since lenders are often hesitant to provide attractive interest rates to less-established businesses. We can test if IEL’s debt levels are sustainable by measuring interest payments against earnings of a company. Ideally, earnings before interest and tax (EBIT) should cover net interest by at least three times. For IEL, the ratio of 113x suggests that interest is comfortably covered, which means that debtors may be willing to loan the company more money, giving IEL ample headroom to grow its debt facilities.
Next Steps:
Although IEL’s debt level is towards the higher end of the spectrum, its cash flow coverage seems adequate to meet obligations which means its debt is being efficiently utilised. Since there is also no concerns around IEL's liquidity needs, this may be its optimal capital structure for the time being. Keep in mind I haven't considered other factors such as how IEL has been performing in the past. You should continue to research IDP Education to get a more holistic view of the small-cap by looking at:
Future Outlook: What are well-informed industry analysts predicting for IEL’s future growth? Take a look at our free research report of analyst consensus for IEL’s outlook.
Valuation: What is IEL worth today? Is the stock undervalued, even when its growth outlook is factored into its intrinsic value? The intrinsic value infographic in our free research report helps visualize whether IEL is currently mispriced by the market.
Other High-Performing Stocks: Are there other stocks that provide better prospects with proven track records? Explore our free list of these great stocks here.
We aim to bring you long-term focused research analysis driven by fundamental data. Note that our analysis may not factor in the latest price-sensitive company announcements or qualitative material.
If you spot an error that warrants correction, please contact the editor at editorial-team@simplywallst.com. This article by Simply Wall St is general in nature. It does not constitute a recommendation to buy or sell any stock, and does not take account of your objectives, or your financial situation. Simply Wall St has no position in the stocks mentioned. Thank you for reading.
